Echoes of History for Investors
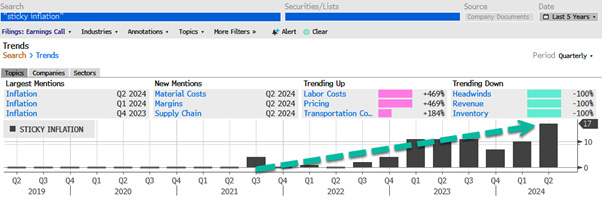
Interestingly, as another sign that the inflation narrative isn't going anywhere, despite the fact that FED Chairman Powell can't see the 'stag' or the 'flation' yet, America's largest companies are warning that consumers are buckling under the weight of inflation. According to Bloomberg data, the term 'sticky inflation' has surged to a record 17 mentions in earnings calls. Other topics on the rise include 'inflation,' 'interest rates,' and 'labour costs.
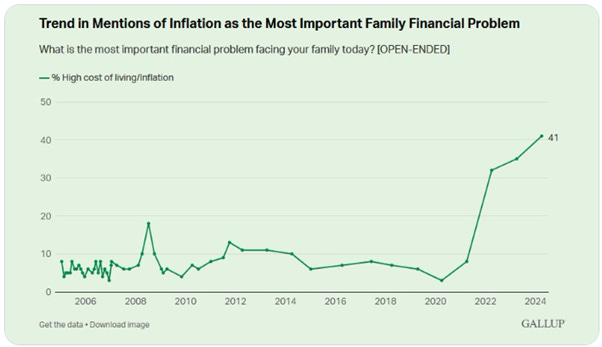
At the same time, according to a recent Gallup poll, the high cost of living/inflation is the most important financial problem for Americans.
The Quarterly Reporting Announcement confirmed that the Q2 US Treasury needs were revised higher to $243 billion (just above the upper end of the consensus) from $202 billion projected last quarter. According to the Treasury, the borrowing estimate was "$41 billion higher than announced in January 2024, largely due to lower cash receipts (i.e. taxes), partially offset by a higher beginning of quarter cash balance." Q3 funding needs (released for the first time) were estimated at $847 billion, just below the upper end of the consensus range of $850 billion.
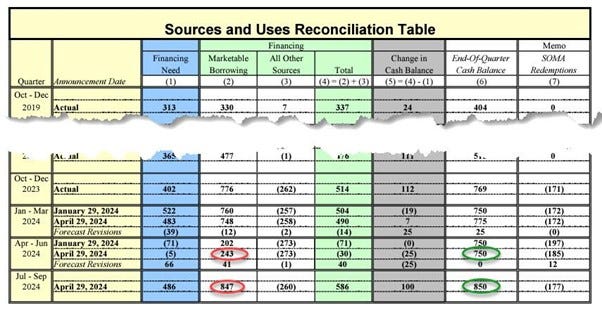
While the Treasury projects a $750 billion cash balance at the end of Q2, this number rises to $850 billion at the end of Q3. Since the streetwide estimate for Q3 end-of-quarter cash was $750 billion, this suggests that the actual funding needs (on an apples-to-apples basis) are actually $747 billion, which is below the median Wall Street estimate.
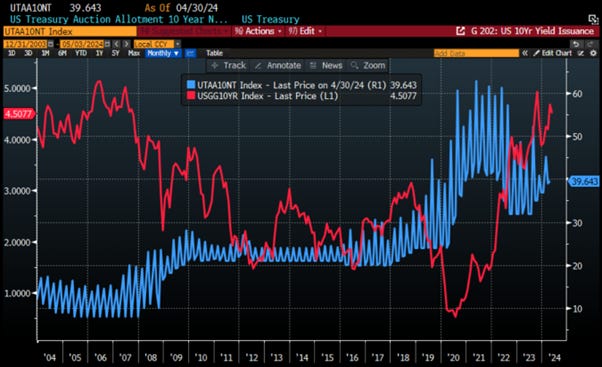
Bottom line, the Treasury reported numbers that mostly aligned with expectations for Q2 and were below the estimate for Q3. This is expected, as the numbers are driven more by political considerations than financial ones. The real question should not be about the Treasury's projections for Q2 and Q3, but rather for Q4, which is after the election, when all the facades may finally be exposed. In that context, with the US Treasury continuing to kick the ‘issuance can’ down the road after the US election, investors should take note that the recent rebound has not been driven by higher issuance, as issuance has been declining over the past 12 months. Those who are still blurred by the "Forward Confusion" narrative and hope that US 10-year yields will move lower should be prepared to absorb a tsunami of issuance once a new president, whoever he or she may be, is elected.
US Treasury Auction Allotment 10-Year (blue line); US 10-Year Yield (red line).
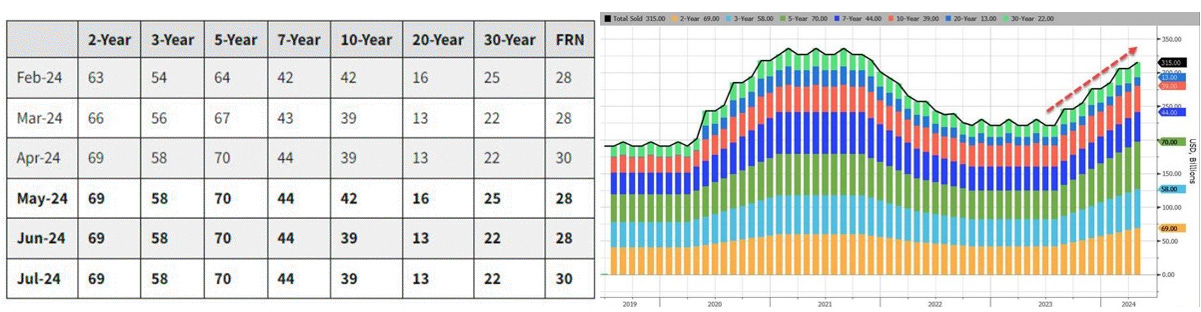
The Treasury kept nominal coupon auction sizes steady as anticipated, with upcoming sales of USD 58 billion in 3-year notes on May 7th, USD 42 billion in 10-year notes on May 8th, and USD 25 billion in 30-year bonds on May 9th. Additionally, it doesn't foresee the need to increase auction sizes for several quarters. This eased concerns despite higher-than-expected financing estimates. Any additional financing needs will be met with increased bill issuance. Primary Dealers anticipate stable auction sizes through the third quarter, with most likely increases after the election and in 2025. Meanwhile, the Treasury will conduct weekly buybacks of up to USD 2 billion in nominal coupon securities and up to USD 500 million in TIPS to enhance liquidity in off-the-run securities.
The Employment Cost Index (ECI), considered one of the best measures of wage inflation, surged to 1.2% quarter-on-quarter, exceeding expectations. This translates to a 4.8% annual growth rate, up from 3.8% in the previous quarter. The increase was mainly driven by wage hikes in the public sector, possibly linked to the Biden administration's efforts to buy support from civil servants hired to implement climate change and diversity policies which will hurt further economic growth.

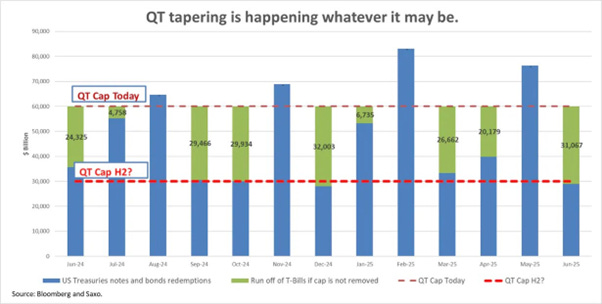
The FOMC meeting confirmed that the FED is highly political and caught off guard, even though this was denied by Jerome Powell. It appears that the FED aims to use the tapering of Quantitative Tightening not only to assist the US government in continuing its politically driven gargantuan fiscal stimulus, but also as a response to the unexpected return of inflation.
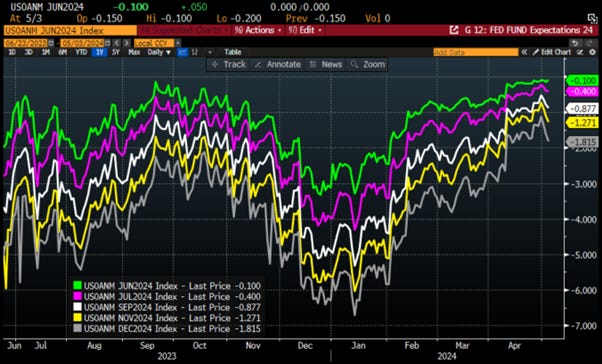
While it is increasingly evident that the FED, despite its ‘MayDay call’, will NOT cut rates in 2024 and that rate HIKES should become the baseline expectation after November 5th, the myopic Wall Street consensus remains driven by the hope of a rate cut in 2024. This sentiment has been spread by the 'Forward Confusion' narrative, increasing the probability of a rate cut in September from 37% to 87%.
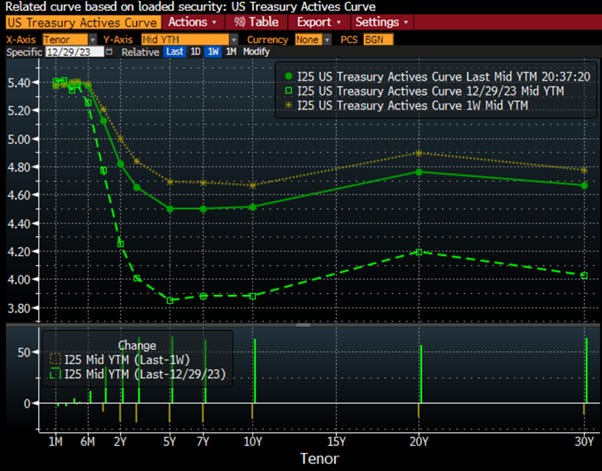
With more data pointing to an inflationary bust, it is surprising that the bear steepener lost some momentum over the past week. Mesmerized by the latest magic trick from Janet Yellen and the ‘MayDay’ call from Jerome Powell, investors should stay aware that the inevitable is the un-inversion of the yield curve by the long end.
Like always behind the curtain, on April 19th, the FED released its semi-annual Financial Stability Report. In the prior five years, the spring edition of the FED’s Financial Stability Report was released in May. This year, for reasons we can only guess, the FED released the spring edition earlier, in April. Given that last spring saw the second, third, and fourth largest bank failures in US history, resulting in over $30 billion in losses to the Federal Deposit Insurance Fund, and one of those banks, Silicon Valley Bank, experienced the fastest run on its deposits in US history, one particular item in the new report that should catch investors’ attention is this:
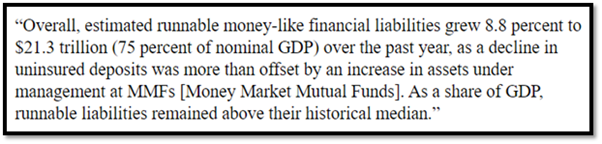
Looking at the nitty-gritty of the FED's FSR report, "runnables" are liabilities that financial institutions must pay on demand by the customer. Zooming in on the runnable component listed by the FED as $6.692 trillion of uninsured deposits, the same uninsured deposits which caused the Bank run at Silicon Valley Bank, Signature Bank, and to a lesser extent, First Republic Bank. The FDIC insures deposits up to $250,000 per depositor, per bank. If there is negative news about a bank’s financial condition, depositors holding large amounts above the FDIC insurance limit will be the first to stampede toward the exits. In March of 2023, it took only a few negative social media posts to start an avalanche of digital deposit withdrawals at Silicon Valley Bank. In the span of just 24 hours, $42 billion in deposits had exited the bank with another $100 billion queued up to leave the next day – meaning it was possible for a federally-insured bank to lose 85% of its deposits in the span of 48 hours in the digital/social media age.
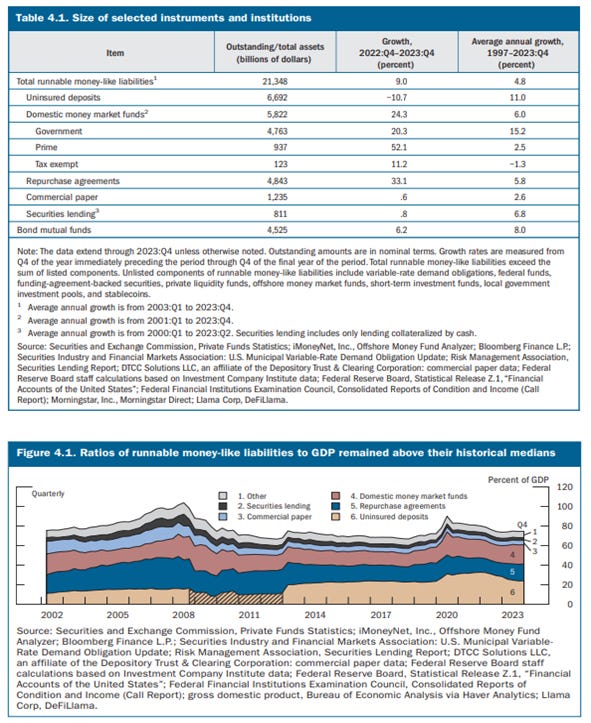
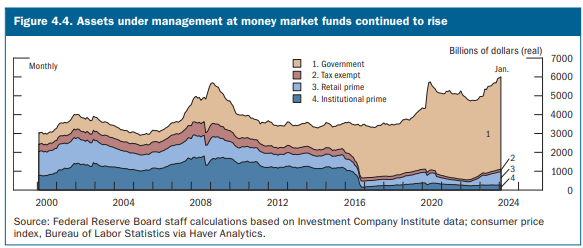
Another runnable listed by the FED is $5.8 trillion in Money Market Mutual Funds. These same funds which had to be bailed out during the 2008 financial crisis and again during the COVID-19 pandemic. Just 6 Wall Street firms received 72% of the $162.9 billion in cumulative loans made under the FED’s money market bailout program during the pandemic. Four of those were Wall Street megabanks.
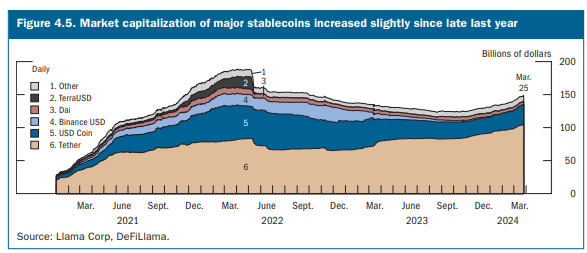
The stability report also focuses on Stablecoins. One aspect that aligns with common sense is the FED's observation that Stablecoins remain structurally vulnerable to runs and lack a comprehensive prudential regulatory framework.
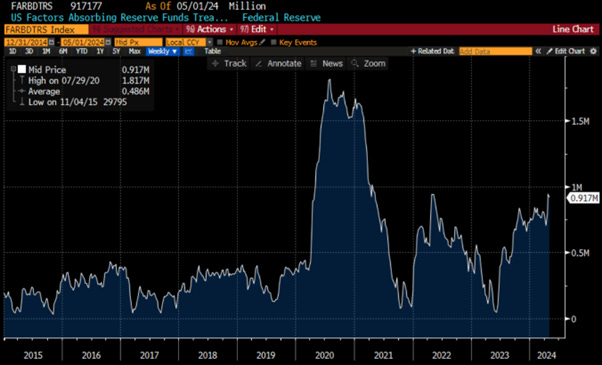
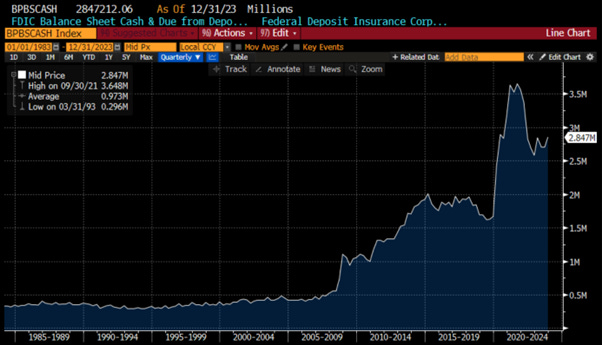
What the FED isn't disclosing is that uninsured deposits are disproportionately concentrated in the largest banks. By year-end 2023, banks in the top 1% of the asset size distribution held approximately 72%of deposits in domestic offices, but about 77% of uninsured deposits in domestic offices. Additionally, the FDIC is essentially running out of cash to safeguard the US banking system.
US FDIC Cash balance.
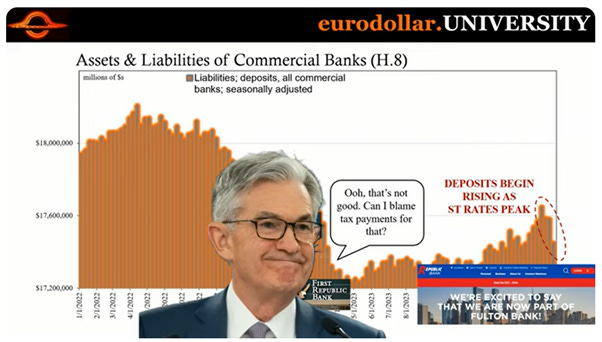
The recent collapse of Republic First Bank in Philadelphia and its "fire sale" to another Pennsylvanian bank, Fulton Financial, for a taxpayer cost of $667 million, reminds investors that the US banking system remains incredibly fragile. Republic First had the same issues as the others that failed last year, too many ‘unrealized bond losses’ on their balance sheet. While Republic First Bank may be too small to have attracted media attention, its failure is symptomatic of another round of an incoming bank run as the US economy slows down and inflation pushes depositors to seek real assets as a hedge for their savings.
Sticking with the significance of money, Elon Musk has once likened it to the operating system of the economy. This analogy could be extended by suggesting that the US Dollar has functioned as the Microsoft Windows of the global trading system, while China is aspiring to position the renminbi as an Apple-style contender against the US dollar’s dominance. For any monetary “operating system” to function effectively and achieve success, it must fulfil several key functions. Specifically, money needs to be:
1. A standard of value (or unit of account).
2. A medium of exchange.
3. A store of value.
4. A medium through which, thanks to interest rates, investors can price the risks of time and credit in the economic system.
The fourth point is often overlooked, yet it remains crucial. Money enables investors to rationally compare the present with the future. However, what happens when money begins to falter? Throughout history, there have been numerous instances of fiat currency failures, while success stories are as scarce as financially successful tech startups. So, how can investors discern when a currency is heading towards trouble? What are the signs indicating mounting problems?
Everyone knows the story of the fellow who jumped out of the 50th floor window and as he passed the 20th floor was heard to say, “well so far, so good.” Now let’s put a twist on the tale. Imagine two fellows jump from the 50th story. As they pass the 20th floor, each looks at the other and says, “well he looks fine, so I must be doing OK too.”
This metaphor largely characterizes exchange rates in developed nations presently. While investors typically compare currencies against each other, simultaneous declines in their roles as stores of value can be overlooked by casual observers, masking currency depreciation. To address this, it's essential to evaluate a country's bond market performance over time relative to other indicators like the local stock market or gold prices in the local currency.
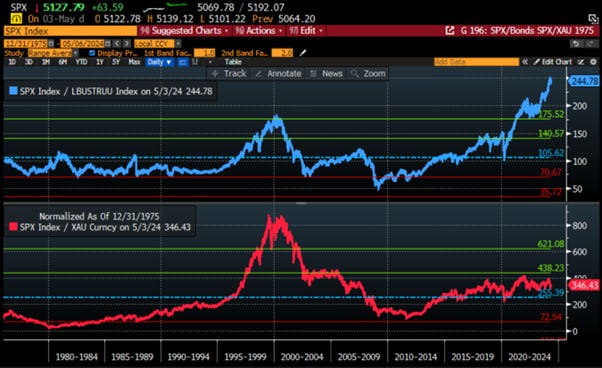
Applying this theory to the US context, over the past 50 years, stocks have never seemed as overpriced compared to bonds as they do now. Previously, equities surged significantly beyond one standard deviation above their long-term trend relative to bonds only during the dot-com bubble, reaching two standard deviations above the mean. Today, they exceed that level by a significant margin. So, US stocks currently could appear historically expensive compared to bonds, surpassing levels seen even during the dot-com bubble. However, when compared to gold, the S&P 500 is just above its long-term mean, suggesting that it's not stocks but rather the bond market that may be losing its value.
Relative performance of S&P 500 to Bloomberg US Agg Index (blue line; upper panel); Relative performance of S&P 500 to Gold Price in USD (red line; lower panel).
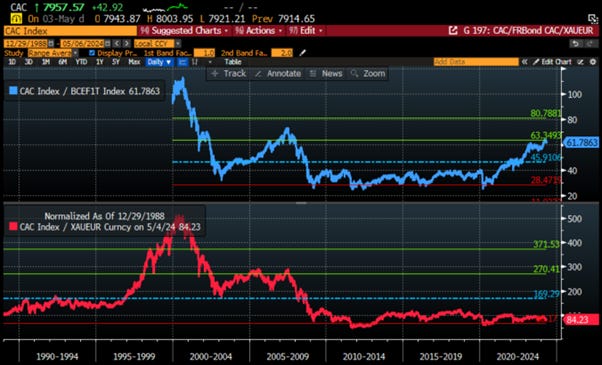
When we consider the same factors for France as a proxy for the European Union, a pattern similar to that in the US emerges. Despite French equities not performing as strongly as US equities over the past decade, the French stock market still seems significantly overvalued compared to French government bonds. However, French equities appear incredibly cheap against gold. This suggests that it might not be equities that are overvalued, but rather that the French bond market is losing its value relative to risk assets such as equities and gold is the new antifragile asset for western investors.
Relative performance of CAC40 to Bloomberg France Agg Index (blue line; upper panel); Relative performance of CAC40 to Gold Price in EUR (red line; lower panel).
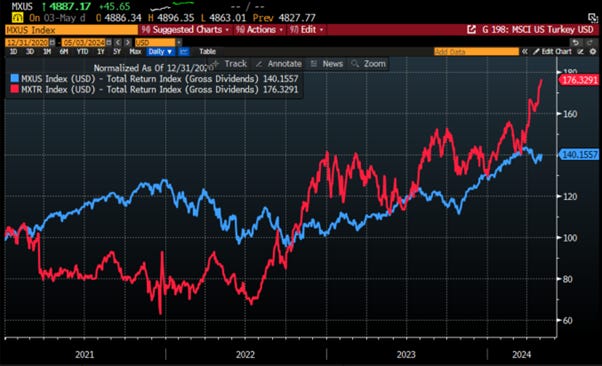
Essentially, this theory revolves around each bond market deriving its value solely in the local currency, which has no intrinsic worth apart from the strength and influence of the issuing economy. Conversely, equities derive their value from real-world companies. Exchange rates and interest rates may fluctuate, but companies like LVMH will continue producing champagne and handbags, Starbucks will keep brewing coffee, and John Deere will persist in manufacturing tractors. Hence, when currencies undergo structural devaluation, investors often seek refuge in stocks. Emerging Markets in general and Turkey in particular serve as a prime example of this trend. Despite the prevailing notion that the US has been the sole destination for capital deployment in recent years, Turkish equities have actually outperformed US equities over the past four years when measured in US dollar terms, including reinvested dividends.
MSCI US Total return Index in USD (blue line); MSCI Turkey Total Return Index in USD (red line).
The prevailing sentiment among investors today is that the rise in bond yield will potentially be leading to a downturn in the gold market, commodity markets, and equity market. In a broadly deflationary environment, such as the one experienced by much of the world over the last four decades, this expectation seems logical. But a Turkish or Argentinian investor could paint a different picture: one where fiscal policy remains gargantuan, where monetary policy is taken over by government treasury departments who need to roll over debt, and where the values of currencies plummet at an ever-accelerating pace.
With US Treasury and the FED having merged for political rather economic reasons, investors are still trying to understand the significance of such a merger and its potential impact on the currency operating system. Indeed, who would have imagined such a merger occurring without affecting the currency landscape? In this context, the recent surge in equity and gold prices, despite the fact that the next move of the FED could be a HIKE RATHER THAN A CUT, rebounding yields, and rising energy prices, raises the possibility that investors have finally understood that the best trade of the 2020s is selling their bonds while they still can exchange them for stocks, gold, or other non-monetary assets like hard commodities or collectibles.
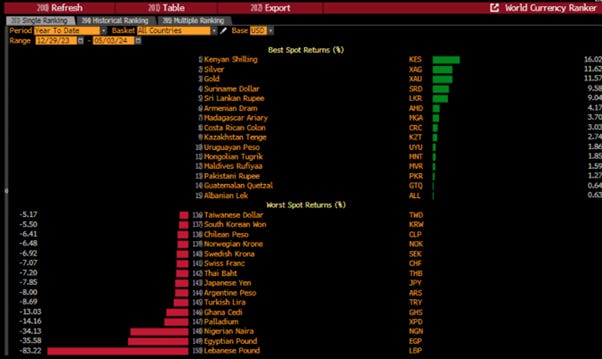
Once again, this behaviour has historically been more characteristic of domestic investors in emerging markets such as Turkey than in the so-called developed economies. In Emerging Markets, governments often showed little concern for long-term fiscal sustainability and relied heavily on local central banks to roll over debt, leaving the central banks ill-equipped to combat accelerating inflation. Today, a similar scenario may be unfolding across North America and Europe due to similar reasons. If so, the next likely step would be for the spot exchange rates of the US dollar and euro to decline against stronger currencies, possibly those of the countries which have not succumbed to the ‘climate change scam’ and are major producer of these ‘hard commodities’ like the currencies of most Latin American and central Asian countries. This outcome may be inevitable, as future exchange rates, as gauged by the bond markets, are already in the process of declining.
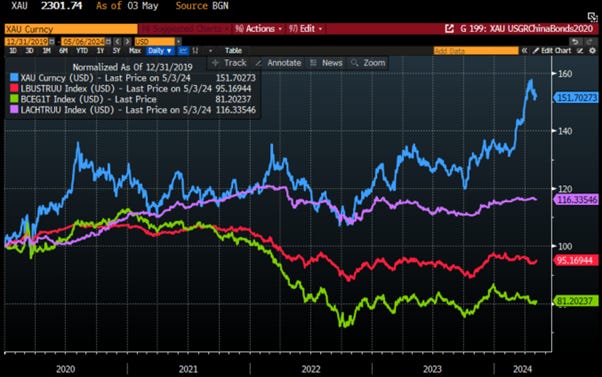
Since the start of 2020, the 10-year US Treasury has experienced a decline of almost -20% compared to the 10-year Chinese government bond and a -57% decrease against gold. Similarly, the 10-year bund has fared even worse, dropping by -35% relative to the 10-year CGB and -70% compared to gold in USD terms.
Gold price (blue line); Bloomberg US Agg Bond Index (red line); Bloomberg Germany Agg Bond Index (green line); Bloomberg China Agg Bond Index (purple line) (rebased at 100 as of 31st December 2019).
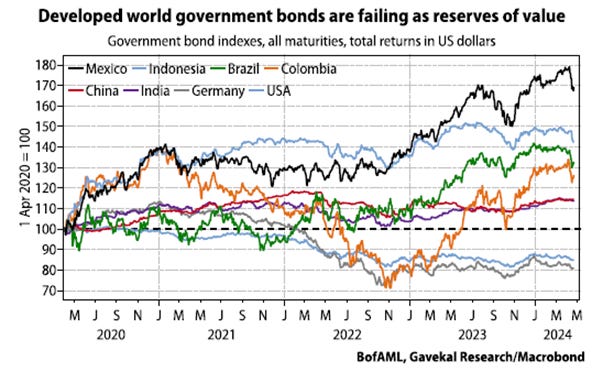
Worse yet, despite a FED tightening cycle, with Chinese growth slowing and a slowdown in emerging markets triggered by Russia's invasion of Ukraine, most emerging market bond markets have still outperformed US Treasuries and German bunds so far this decade, and not by a small margin, but significantly. This presents investors with one of two possible conclusions:
An unprecedented and highly unusual development in global bond markets that is unlikely to endure is unfolding in front of investors’ eyes.
The world is undergoing change, and developed world bond markets are failing in their primary role of providing a reliable store of value. They will continue to fail at this task unless there is a dramatic shift in developed world fiscal and monetary policies.
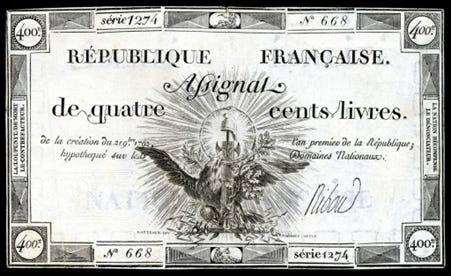
For investors who remain unconvinced that government bonds in developed markets, once considered risk-free assets, are NOT FREE OF RISK ANYMORE, and for those who argue that the economic struggles of countries like Turkey and Argentina, often labelled as "banana republics" by the Western elite, are isolated incidents that could never happen in the US, it's crucial to examine history and cultural indicators that suggest inflation will worsen and spiral out of control sooner rather than later. To gain insight into these cultural signs and historical precedents of inflation, one can look back to France during the late 18th century, particularly during the period ahead of the French Revolution of 1789. Andrew Dickson White's book, 'Fiat Money Inflation in France,' published in 1896, offers a valuable historical perspective on the Assignats and France's descent into inflation in 1789.

Fiat money inflation in France was a notable economic crisis that unfolded in the late 18th century, notably ahead of the French Revolution. It stemmed from the government's extensive printing of paper currency, called assignats, which resulted in a rapid devaluation of the currency and an ensuing spiral of inflation. Originally issued to fund war efforts and alleviate debts, assignats instead sparked economic turmoil and hyperinflation. The severity of the crisis played a significant role in the downfall of the French monarchy and the emergence of the French Revolution.
There are a number of key warnings that appeared in 'Fiat Money Inflation in France,' which can be summarized in 13 points. These points will look familiar in the current situation in the US. Those who want to delve deeper into these points should not miss the book, which should be compulsory reading for every macro strategist.
It always starts the same way. Business is slow and the government is looking for a shortcut.

In the beginning there is resistance to large issuances of debt. It is seen as being financial imprudent. But gradually the politicians and the people learn to crave it, and the debt increases exponentially. There is no more resistance.
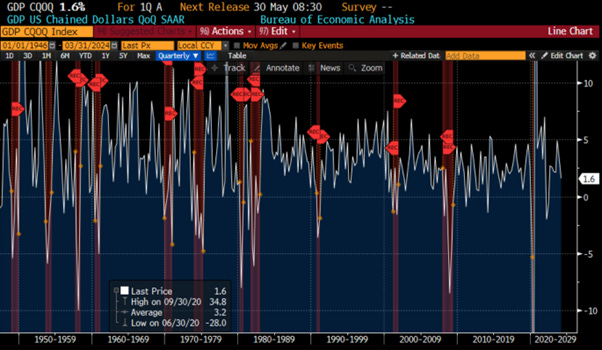
The economy rebounds after every stimulus, but the rebounds get shorter and shorter.
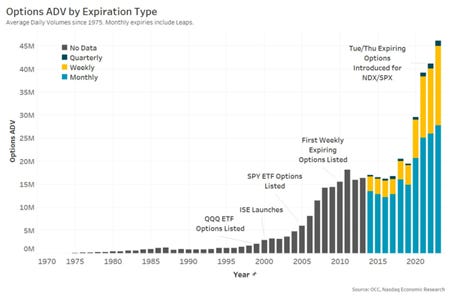
There is an obsession with trading and speculation.
Speculation and inflation lead to corruption.
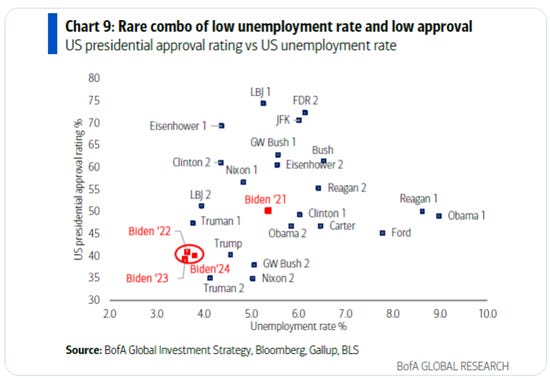
Trust in politicians and the media declines.
The Speculators realize they should borrow to buy assets.
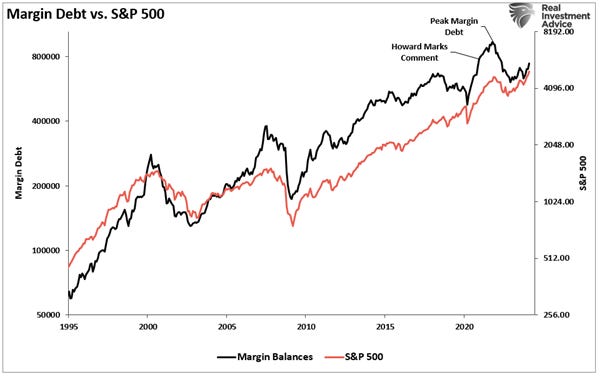
The rise of the Debtor Class.

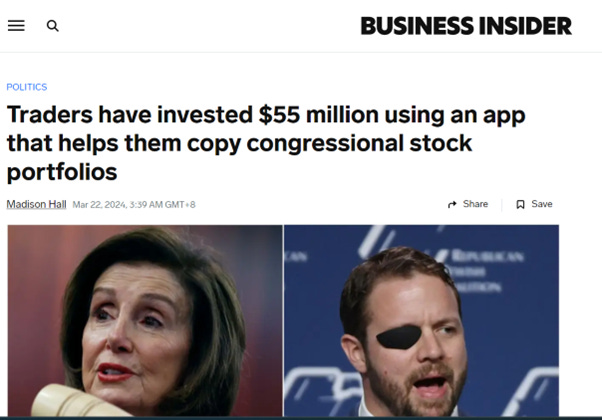
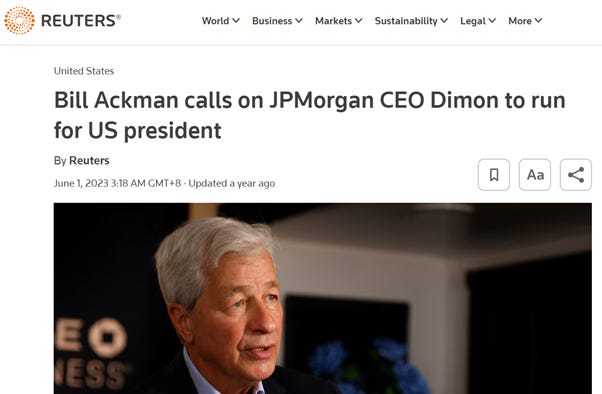
The Debtor Class become celebrities and mix with the politicians.
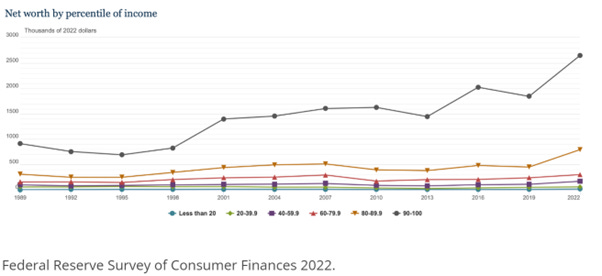
As the wealth disparity increases there are calls to expropriate wealth from the rich.

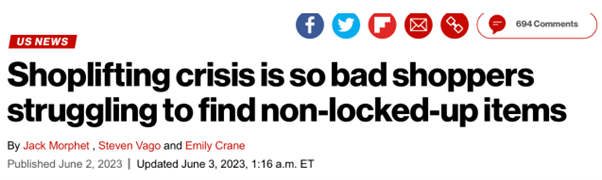
As daily goods get too expensive, people start to loot the stores.
Smart speculators buy up the personal property of the working class.
![]()
An enormous wealth disparity develops between those who saw what was happening and purchase more real assets, and those who didn’t.
Read more and discover how to position your portfolio here: https://themacrobutler.substack.com/p/echoes-of-history-for-investors
At The Macro Butler, our mission is to leverage our macro views to provide actionable and investable recommendations to all types of investors. In this regard, we offer two types of portfolios to our paid clients.
The Macro Butler Long/Short Portfolio is a dynamic and trading portfolio designed to invest in individual securities, aligning with our strategic and tactical investment recommendations.
The Macro Butler Strategic Portfolio consists of 20 ETFs (long only) and serves as the foundation for a multi-asset portfolio that reflects our long-term macro views.
Investors interested in obtaining more information about the Macro Butler Long/Short and Strategic portfolios can contact us at info@themacrobutler.com.
Unlock Your Financial Success with the Macro Butler!

Disclaimer
The content provided in this newsletter is for general information purposes only. No information, materials, services, and other content provided in this post constitute solicitation, recommendation, endorsement or any financial, investment, or other advice.
Seek independent professional consultation in the form of legal, financial, and fiscal advice before making any investment decisions.
Always perform your own due diligence.