


Big Trouble Brewing Beneath The Surface
(Written by Bert Dohmen & Dion Dohmen, contains excerpts from our latest October 18, 2026 Wellington Letter)
Last week started out rather calm, but once the “hot” September CPI inflation reported was published on Wednesday, volatility entered the market and stocks had sharp down-moves by the end of the week.
One of the primary negative catalysts last week involved renewed worries around the AI infrastructure buildout, which caused big selloffs in semiconductors and AI related stocks.
CoreWeave (CRWV), a data-center company and one of the largest “neocloud” firms, is at the center of these worries. The firm has taken out over $51 billion in debt in order to finance its plans for expansion, which involves purchasing more Nvidia chips and building more data centers.
CRWV’s bonds sold off sharply last week as yields on some of its corporate bonds are now yielding above 15%, signaling elevated distress.
The cost of five-year insurance against a default by CoreWeave (i.e. “credit default swap,” CDS) briefly spiked above 1,140 basis points. It most recently sat near 1,038 bps, which is a 16% increase from last week and 164% higher than a year ago.
The widening spread means investors are demanding a significantly higher premium because they see a meaningful chance the company may default.
We warned about the AI financing problems when there was so much hype around the AI buildout plans four months ago in our June 21 Wellington Letter saying,
“A big “fly in the ointment” is the incredible thirst for capital by AI firms. We have asked rhetorically several times, “where will all the money AI firms plan to raise come from?”
Roughly two weeks ago we got the signal that money is not infinite. One the biggest and best connected investment firm, SoftBank from Japan, had trouble raising money.
It first tried to raise $10 billion. Failing to get that, it cut that down to $6 billion. That is 40% less. The firm said it would use its stake in OpenAI as collateral. Currently, the margin loan attempt has stalled, which shows there is still reluctance.
This is a signal that credit is tightening.”
CoreWeave’s stock plunged 15.5% on Wednesday, October 14. It then had an intraday reversal off its lows the following day but the heavy selling was restarted again on Friday as the stock plunged another 11.9%. For the week CRWV stock plunged more than 25%.
Other semiconductor-related stocks also endured big declines as a result, with the major semiconductor ETFs now falling 9 consecutive days for a loss of 17.4%.
We continue to warn our members to ignore all the hype constantly promoting this sector in the mainstream financial media, at least right now. The risk is too high at this time. This puts the large cap indices that are heavily dependent on these chips stocks at risk (S&P 500, NASDAQ Comp & 100).
Goldman Sachs says, “AI infrastructure stocks are expected to drive more than half of S&P 500 EPS growth in Q3.” With the troubles surrounding the AI buildout plans, as we explained above, these stocks could became huge liabilities when they report their earnings in the coming weeks, especially given their huge weightings in the S&P 500 index.
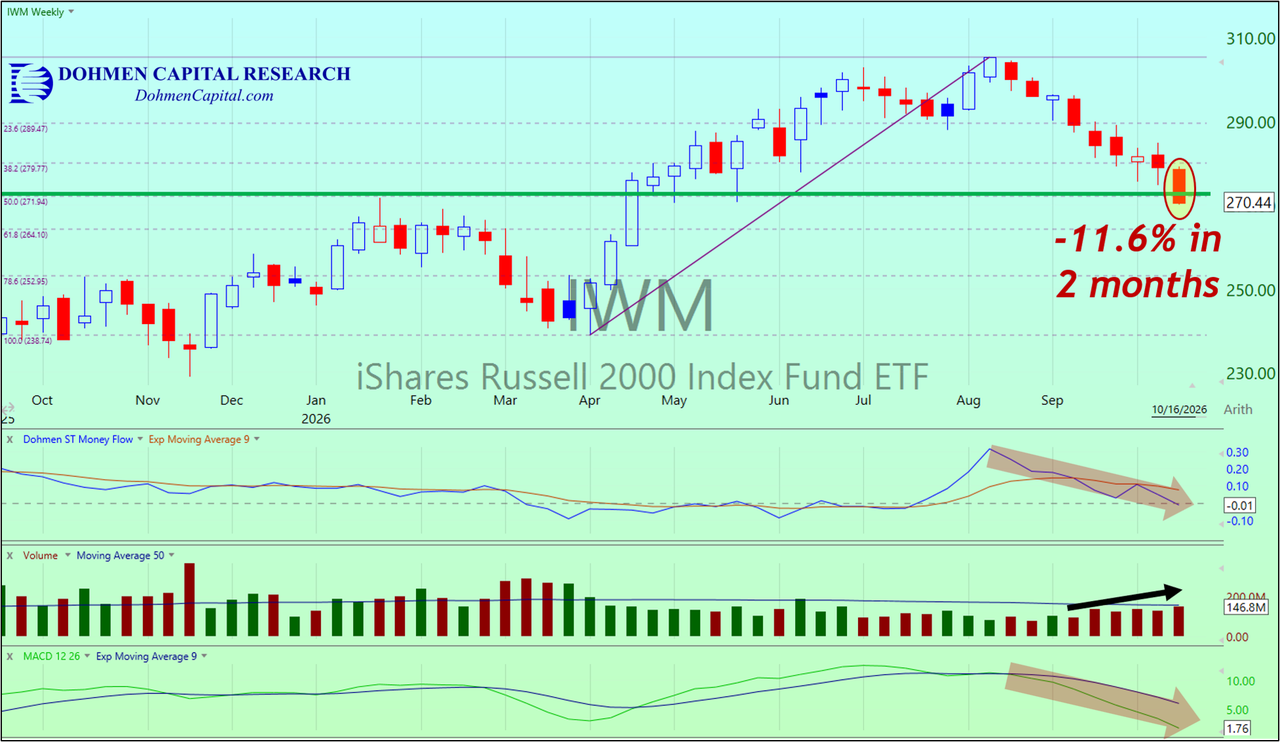
THE CHARTS: After such destruction last week, let’s look at the weekly intermediate-to-longer term trends. The weekly of the ETF for the Russell 2000 index, IWM, shows the constant selling in small caps since mid-August. It has now declined for 6 consecutive weeks and down 7 of the past 9 weeks for a total loss of 11.6%.
This week is broke below the 50% Fibonacci retracement (green horizontal line, yellow shaded oval), which should have been strong support. That makes the next target support level around 265, which coincides with the January-February closing highs.
The Dohmen Money Flow (middle, red arrow) peaked in mid-August and has been declining while the MACD (bottom, red arrow) has been on a “sell” signal since that peak and has widened. That is bearish.
Volume (black arrow) has increased during the 6-week plunge, which is also bearish. Therefore, small caps should continue to see further downside in the coming days and weeks.
While the above ETF is broad, it only represents small cap stocks. So let’s look compare it to the longer-term weekly chart of our favorite broad market gauge, the equal weighted VALUG Index.
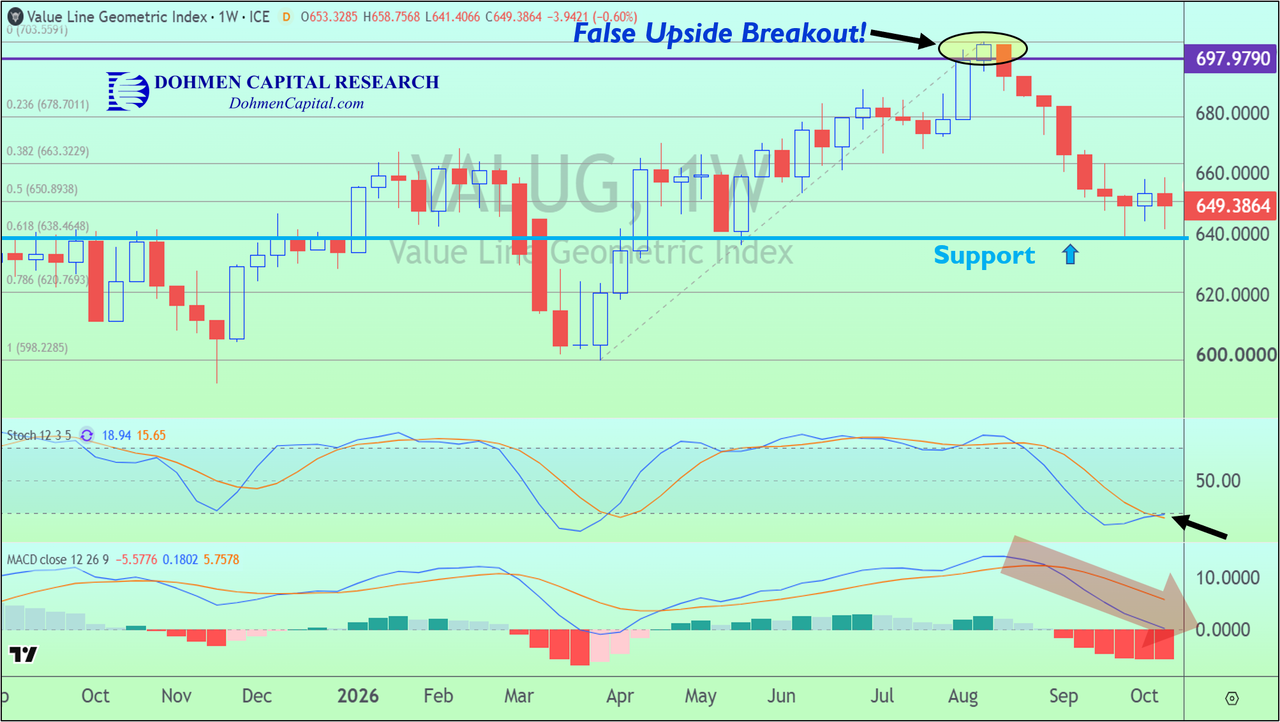
In our August 23rdWellington Letter we pointed out the false upside breakout on the chart. That was the start of the current plunge.
Then, in our October 4thWellington Letter we explained how our target support level around 640 (light blue horizontal line) was reached and the technicals were giving near-term “buy” signals.
We got the rebound we expected over the ten days but there was no real strength behind it, resulting in another negative week this past week, its 8th down week in the past 9.
And while the shorter-term fast stochastics indicator (middle, black arrow) is in “oversold” territory and now trying to cross to the upside, the longer-term MACD (bottom, red arrow) has been declining since the mid-August top and also widening, similar to the IWM above. That suggests bearish momentum is accelerating and the longer-term downtrend is still intact.
Therefore, any potential bounce in the near-term will likely be faded, resulting in a break of support and a continuation of the decline. The 620 price level would be next support, however, the 600 area is more likely to act as a sustainable bottom.
CONCLUSION: It appears that big trouble is brewing beneath the surface and the markets are now in “risk off” mode with the large-cap indices now finally “catching down” to the broader indices.
This can become dangerous, especially for anyone who is heavily invested in tech, AI, and chip stocks (we and our members who follow our research services are not).
The scramble is now to raise cash, especially over the weekend as investors digest the heavy selling that took place in the NASDAQ and S&P last week.
All the money that flowed into the “high-flyer” stocks and sectors over the past few months will flow out and go to cash.
Now investors are wondering if the AI bubble could be bursting and whether this latest selloff could be an important warning for the markets, possibly turning into a correction, bear market, or worse, the next financial crisis.
We dive into what we believe could be “The Trigger For The Next Global Financial Crisis” in our latest 18-page special report. And for a limited time, ZeroHedge readers can get a FREE copy at DohmenCapital.com/FreeReport2026.
In this report we also reveal important strategies smart investors can use in order to protect their hard-earned wealth and profit when most others panic.
Click this link to claim your free report
Wishing you successful investing,
Bert Dohmen & Dion Dohmen