Sponsored Content
What really drove gold’s violent January reversal
Gold Fundamental Analysis
In the first month of 2026, there has been some extraordinary market action. The price of gold leapt from $4,347 on January 2 to an intraday high around $5,600 on Thursday January 29. That is almost 30%! In a month!
But on Friday January 30, the price crashed, ending the day at under $4,900.
As expected, the selloff triggered claims that gold had been deliberately “smashed.” That explanation is familiar but inconsistent with what the intraday data shows.
We do not usually publish intraday charts. This time, we had to.
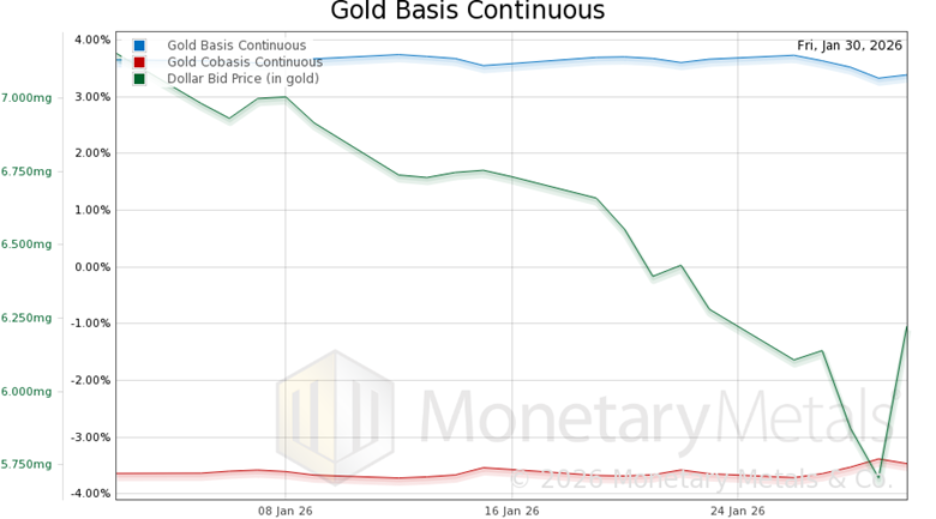
NB: the daily price and basis are taken around the PM Fix at 3pm London time
Looking first at January as a whole, the gold basis remained largely flat even as price accelerated. That alone tells us something important: supply and demand fundamentals barely moved during the rally. The price ran ahead of them.
A quick refresher: the basis is calculated as future price minus spot price. We have published a lot of theory about it, but at a mechanical level there are four cases.
- Price rising, basis rising: futures are bought more than metal
- Price rising, basis falling: metal is bought
- Price falling, basis falling: futures are sold
- Price falling, basis rising: metal is sold
Now, let’s zoom in.
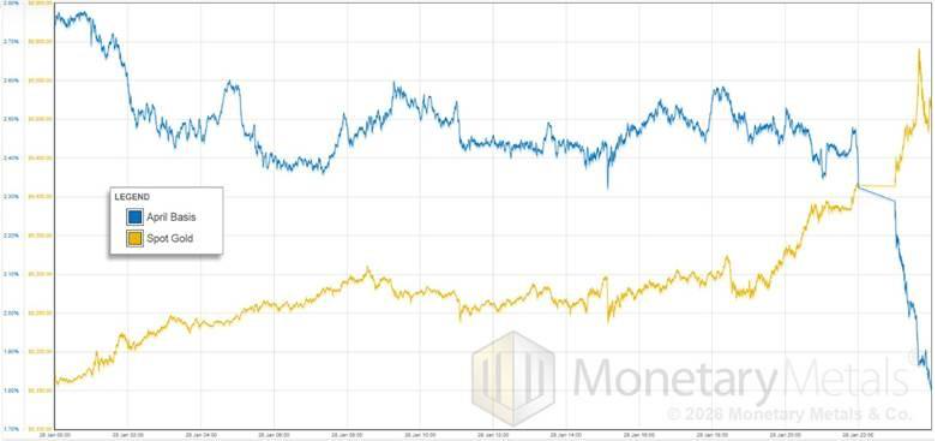
NB: This chart shows the April basis, whereas charts above show the continuous basis which is 6-month duration, times shown are London time
With that big increase in price on Wednesday January 28—from $5,150 to $5,550—the basis drops from 2.8% to 1.8% (the part near the right side, where price and basis show a straight line is after the New York close and before the Globex open).
This is a chart showing the price being driven up fast, by a lot of buying of metal.
But Thursday January 29 is a different picture.
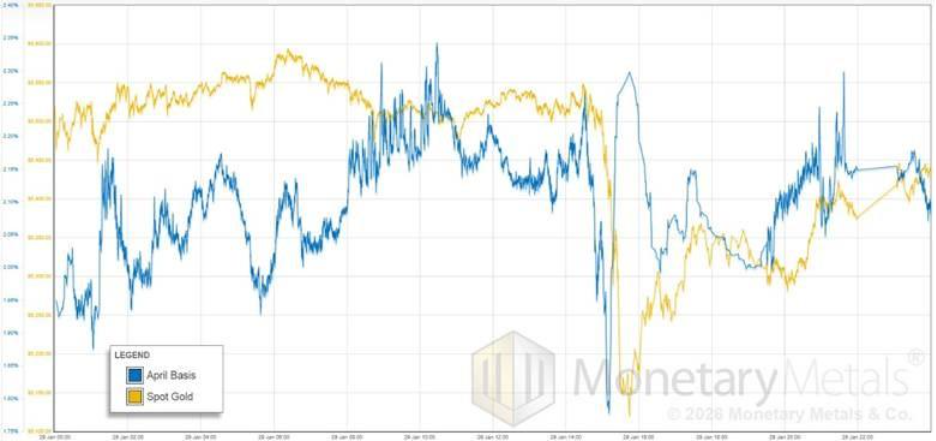
The price is rangebound from midnight to around the time of the PM fix. During this time, we mostly have a rising basis. We read this as an absence of metal buyers, and the price is held up by buyers in the futures market.
Then the basis drops about 50bps, while price initially hold steady. Then the price drops about $400, but by that time basis is sharply rising already. This is selling of metal, pure and simple. Futures speculators try to front-run what will happen with demand for metal, but this time they got it wrong big-time.
Next, the basis shoots up and recovers its previous level. The price moves up, but only about $200. This is buying of futures (perhaps short-covering). The rest of the action is basically basis and price moving together, i.e. futures are driving the action.
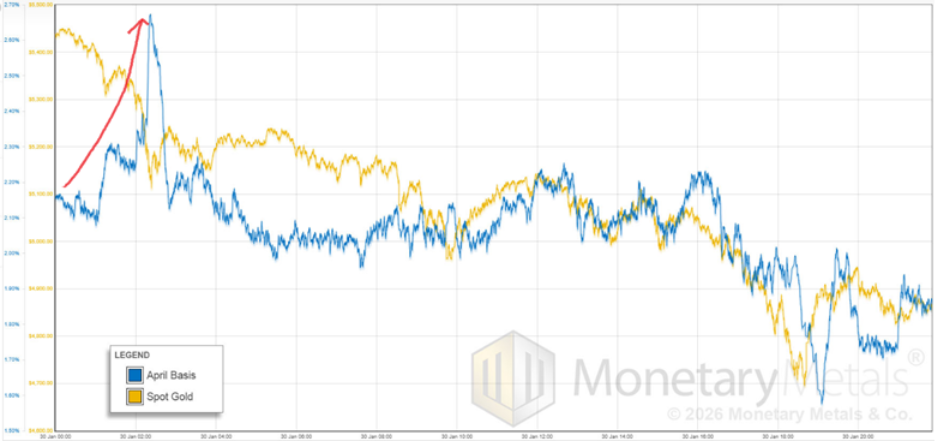
On Friday January 30, the basis and price move together. This is selling of futures, we assume a giant flush of leverage in the market. Note that spike up in the basis, around 50bps. This is buying of futures, but it’s not enough to hold the price up against the selling of metal.
What has changed?
This matters because a true “smash” — a massive, futures-led price attack — would have driven the basis deeply negative. As the above charts show, that did not happen.
More importantly, nothing fundamental broke. By week’s end, the April basis remained well below prevailing interest rates, meaning there was still negative profit to carry metal. Physical supply and demand remained tight. The market simply corrected an overshoot.
What changed was not the structure of the gold market, but the price level.

Download the full Gold Outlook 2026 report for free here.
At Monetary Metals we have created a way where those that hold gold can still increase their ounces regardless of the price.
Learn how to earn more with gold here.