


A Dark Storm Is Gathering Over The Housing Market
Submitted by QTR's Fringe Finance
I’ve been warning about the continued risks surrounding AI steadily since August, and I continue to believe we’re going to see more bad news from the sector that has driven the bull market of the last few years.
I also think more bad news is coming for Nvidia and I’ve also warned about crypto, and the shaky price action we saw this weekend reinforces my view that more volatility and downside could be ahead.
I know, it’s a downer for a Sunday morning. And spoiler alert: today’s column isn’t going to be bright and cheery, either. Hey…if I have to suffer on Sundays as an Eagles fan this year, I’m insisting you must suffer, too.
But in all seriousness, today I’m going to focus on a concern I’ve had dating back for the last year or so in an area that isn’t talked about much, but where a deluge of newly released data is giving cause for some nascent concern: housing.

Financial stress doesn’t necessarily remain confined to one asset class. It’s the reason I’ve been barking about commercial real estate, subprime auto paper, regional banks, equities, crypto and bonds for the last year. Today I’m going to bark about housing.
Weakness in speculative investments can coincide with a broader pullback in risk-taking, tighter credit conditions, and more cautious consumer behavior. That doesn’t mean declining crypto prices automatically translate into falling home prices, but it’s worth considering how financial pressure moves through household balance sheets, particularly when housing affordability is already stretched.
There’s a general sequence that often develops when people need cash. They typically begin with their most liquid assets…first stocks, crypto, and other investments that can be sold quickly. Cashing out CDs, savings accounts and the likes. Then, when cash is scarce, they sell the dung heap of crap they’ve been amassing…their collection of Jordans or Pokemon cards or Steve Wilkos show official memorabilia (or whatever the hell ‘collector’ shit is in in the year 2026) …then their new consumer electronics they just bought for themselves on credit that they don’t need.

“Get the hell off my stage! You don’t deserve a chair!”
As financial pressure builds, some households increasingly rely on credit cards, followed by unsecured personal loans when additional borrowing is available. Eventually, larger assets such as cars, boats, or other possessions may be sold to generate cash or reduce monthly expenses.
Housing often comes way later in that process. Selling a home takes time, involves substantial transaction costs, and may require finding somewhere else to live. Homeowners generally have strong incentives to avoid selling unless circumstances require it. But prolonged financial stress can eventually lead to more listings, increased borrowing against home equity, missed HELOC or mortgage payments, and forced sales.
Housing has historically experienced long boom-and-bust cycles, sometimes spanning 15 to 20 years or more, although there is no fixed timetable. We’re now approaching 20 years since the 2007–2008 housing crisis, making it worth considering where we stand in the current cycle. Not every household follows the same financial progression, but housing often responds to economic deterioration with a significant lag, which is precisely why the emerging weakness in today’s data deserves attention.
I’ll say up front these are not “outright panic” numbers. But they are a collection of multiple newly released data points all heading in the very wrong direction at the same time peoples’ retirement accounts and stock portfolios are starting to come under pressure. And the point of this “fringe” blog that I write is to be early…very early…in pointing out trends.
So think of this data not as definitive proof we’re going to see a housing crash, but maybe a damn important ingredient in a potential recipe for a perfect storm at some point that may start a housing correction in 2027.
The latest debt data suggests some of that financial pressure is already building, according to Bloomberg. Per the Federal Reserve Bank of New York’s third-quarter Household Debt and Credit report, released November 10, the share of overdue consumer loans increased to 5% from 4.7% in the previous quarter, while total household debt rose 1.8% to $19.1 trillion.
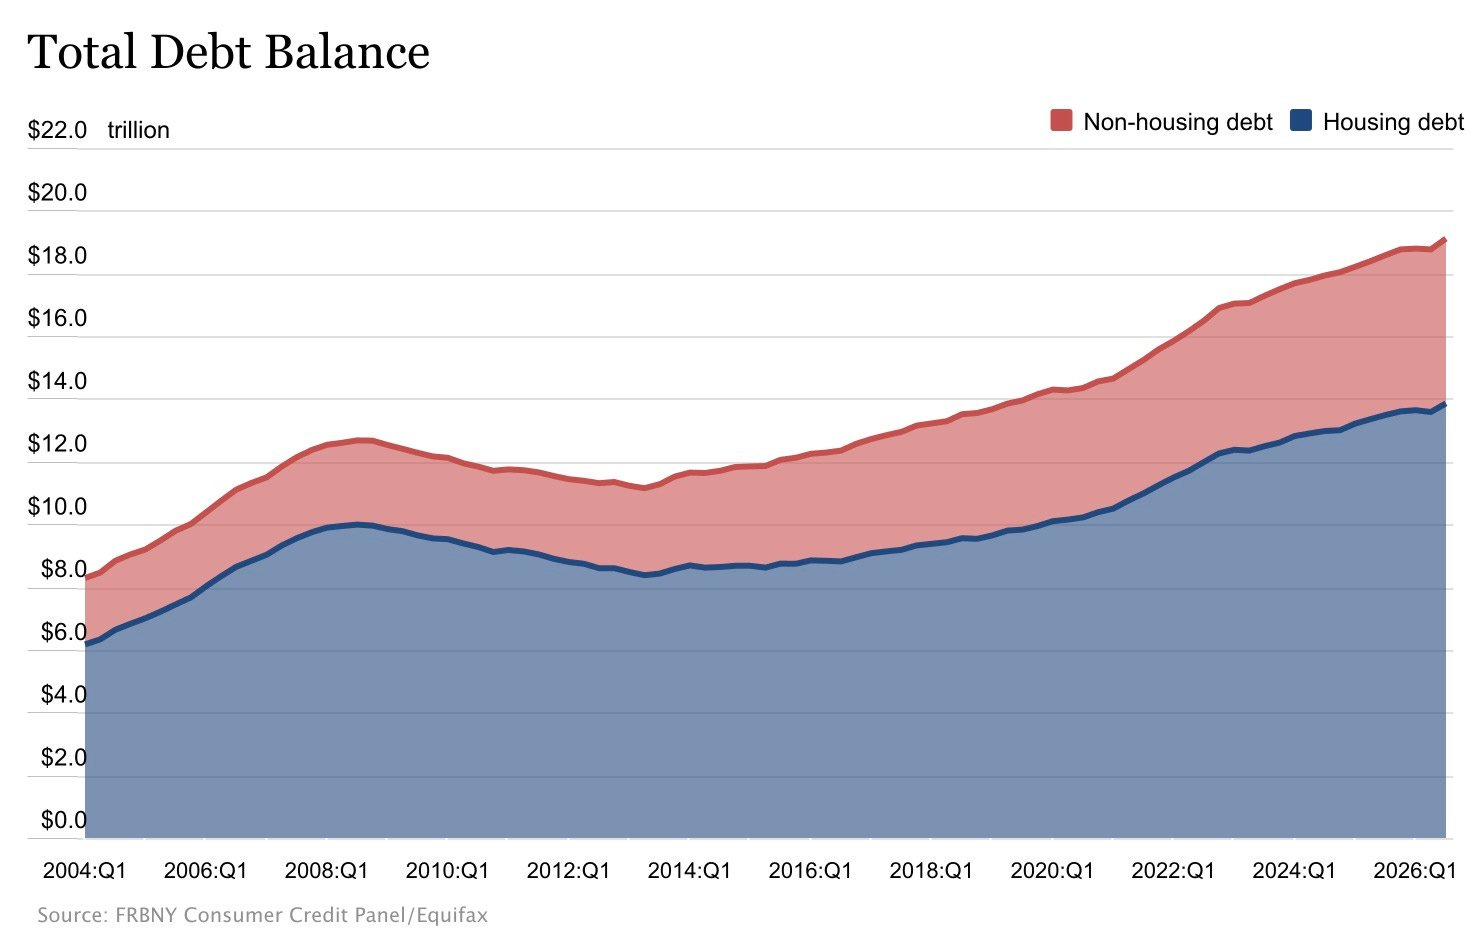
Separately, Urban Institute research found that 5.8% of Americans had at least some delinquent credit card debt, compared with 4.3% in August 2019. Approximately 5.5% had delinquent auto or retail loans, up from 3.9% before the pandemic. These figures suggest that financial pressure is extending beyond housing and affecting multiple categories of household borrowing.
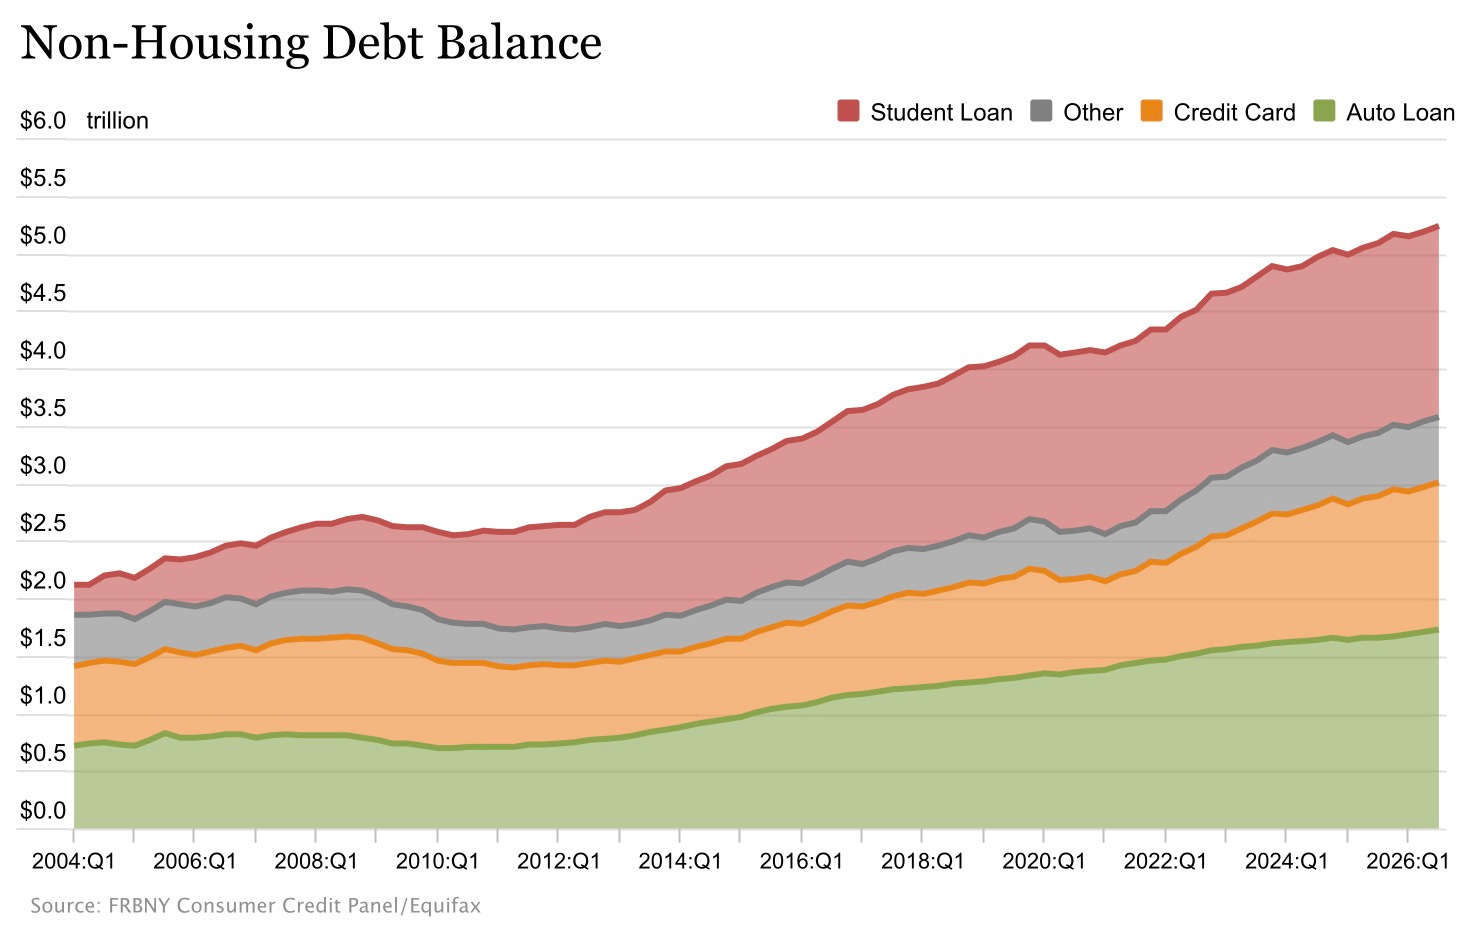
More concerning for housing, the share of mortgage balances more than 90 days overdue reached 1.13%, its highest level since the first quarter of 2018.
Meanwhile, outstanding home equity line of credit balances increased by $23 billion during the quarter, the largest quarterly increase since 2005 and the 18th consecutive quarter of growth.
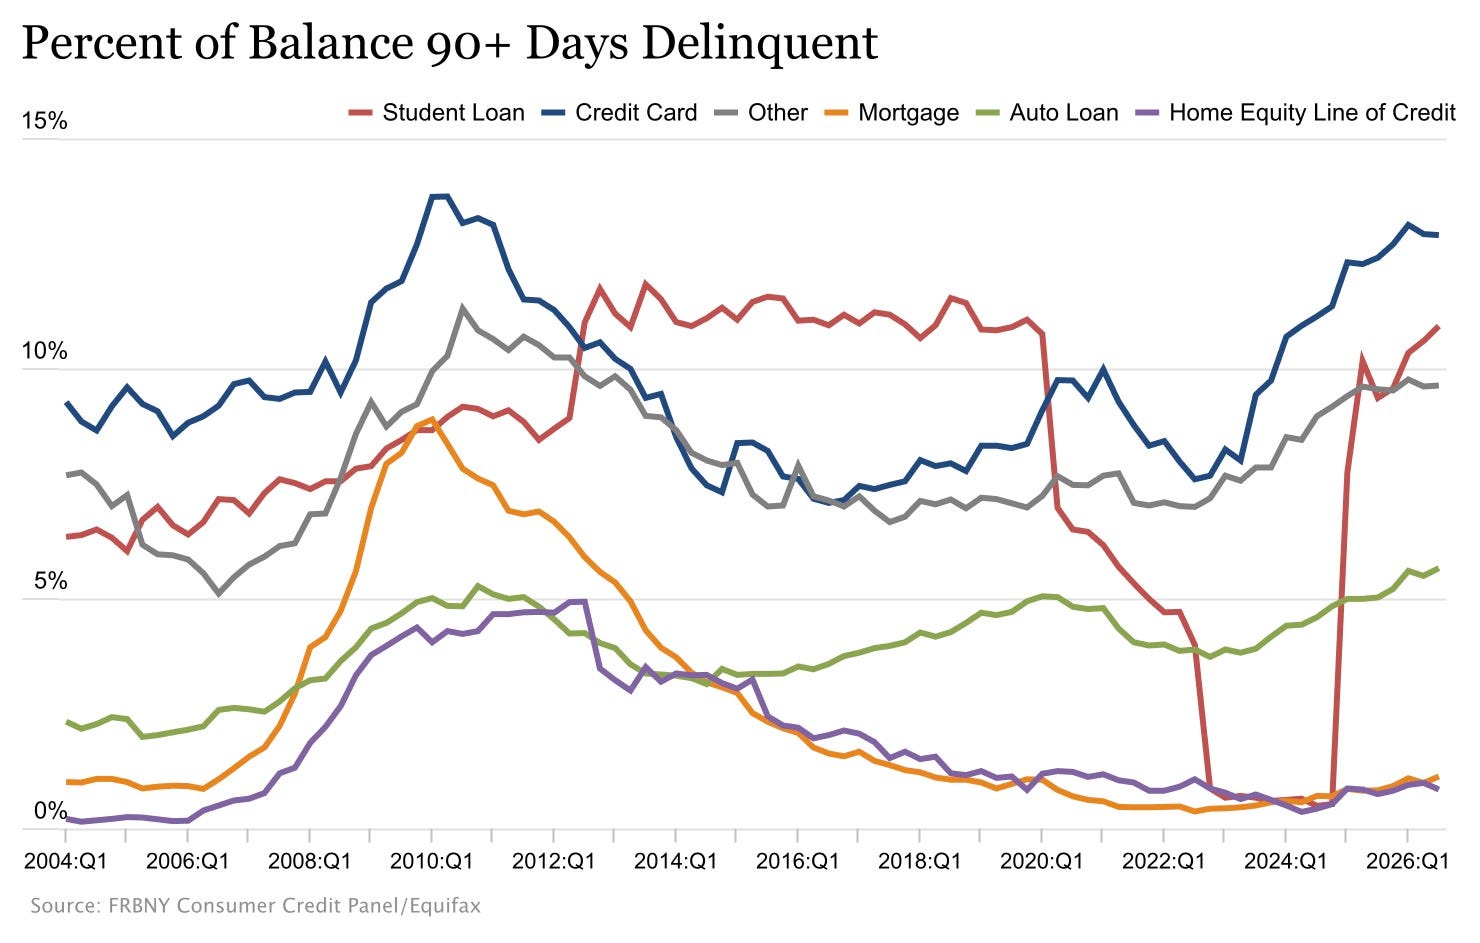
Rising HELOC balances don’t necessarily indicate financial distress, since homeowners also borrow against equity for renovations and other expenses. And New York Fed researchers emphasized that overall mortgage credit quality remains strong. Nevertheless, the combination of rising household debt, elevated consumer delinquencies, and increasing mortgage distress deserves attention, particularly given how weak housing demand has already become.
Again….not “panic” numbers, but not pretty, either. We’re not at the point where widespread mortgage defaults or forced selling are driving the national housing market. However, the latest data suggests the market is weakening, and several indicators are moving in the wrong direction.
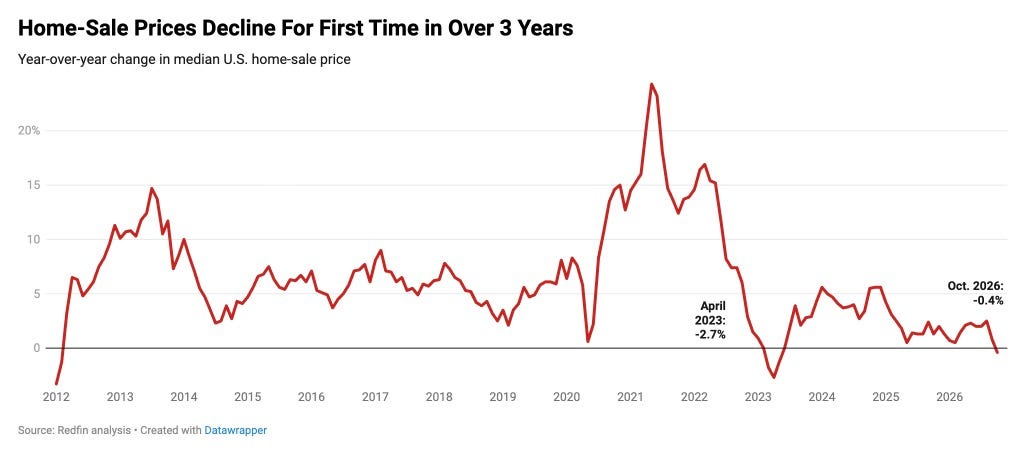
According to Redfin’s November 10, 2026 report, the median U.S. home-sale price declined 0.4% year over year in October, reaching approximately $388,634. This marked the first annual decline in more than three years.
Just two months earlier, home prices were still increasing approximately 2.5% annually. A 0.4% decline isn’t particularly large on its own, and median prices can be affected by the mix of homes being sold, but the change in direction is worth noting.
The bigger concern is transaction activity.
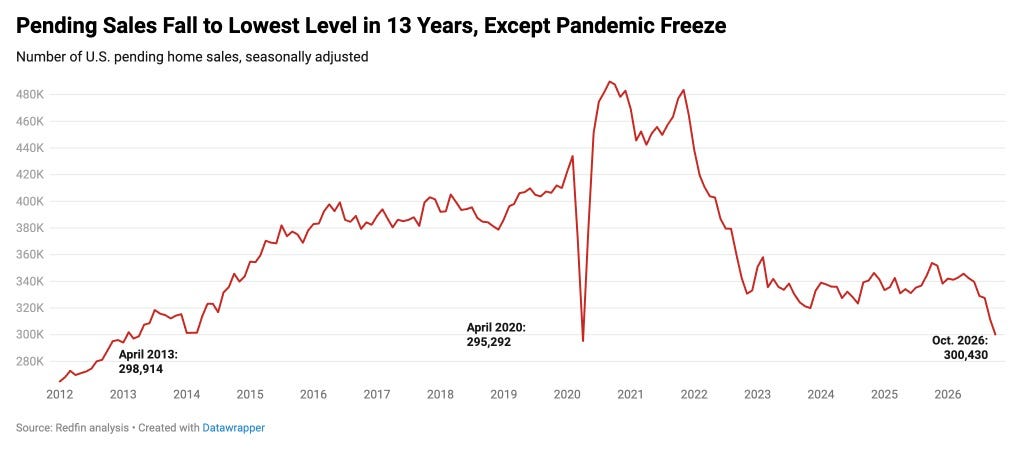
Redfin reported that pending home sales declined 15.1% year over year and 3.6% from September. Pending sales reached their lowest level since 2013, excluding April 2020 during the initial pandemic shutdowns. Because pending sales represent homes under contract, they provide an indication of future completed transactions. Sustained weakness suggests that buyers are having difficulty absorbing available inventory at current prices and financing costs.
The National Association of Realtors reported similarly weak conditions in its November 12 release. Existing-home sales declined 5.5% month over month and 8.8% year over year in October, falling to a seasonally adjusted annual rate of 3.75 million homes.
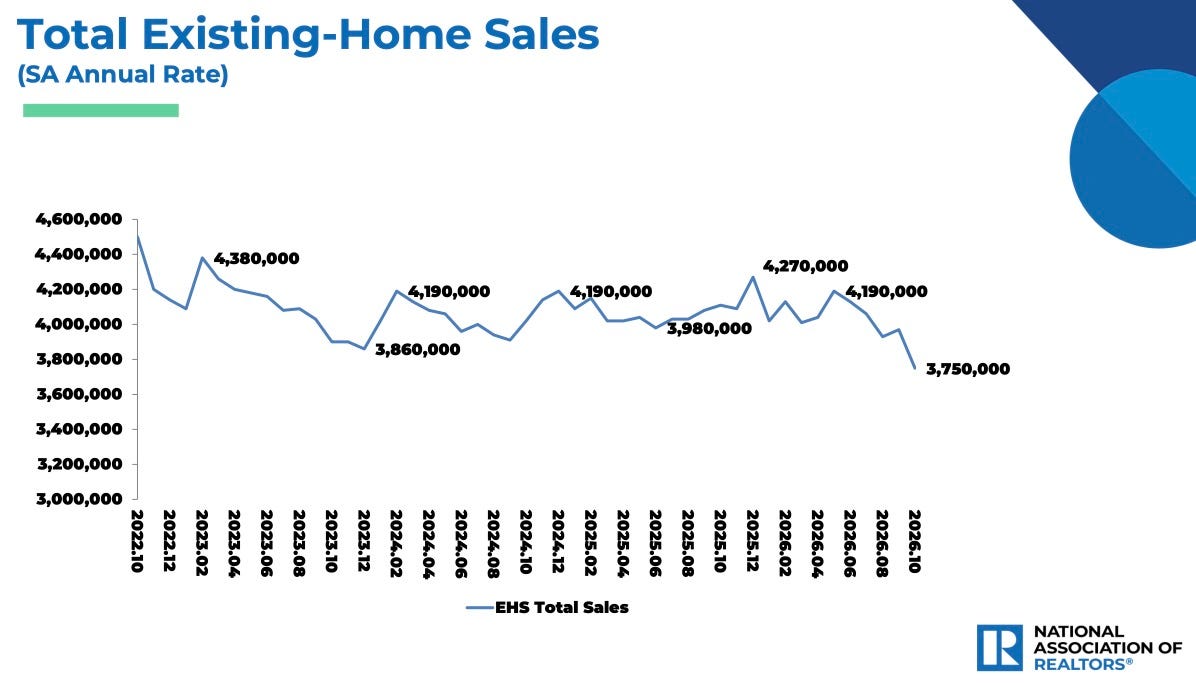
That was the lowest level since August 2010. The comparison doesn’t mean today’s market has the same underlying problems as the post-financial-crisis housing market, but it does demonstrate how severely transaction activity has slowed.
Inventory is also increasing relative to demand. The National Association of Realtors reported 1.59 million existing homes available for sale in October, an increase of 4.6% from the previous year. Months of supply rose to 5.1, compared with 4.4 a year earlier. Redfin separately reported that active inventory reached its highest level since early 2020. These measures aren’t identical, but both point toward a market in which homes are taking longer to sell and available supply is increasing relative to the number of buyers.
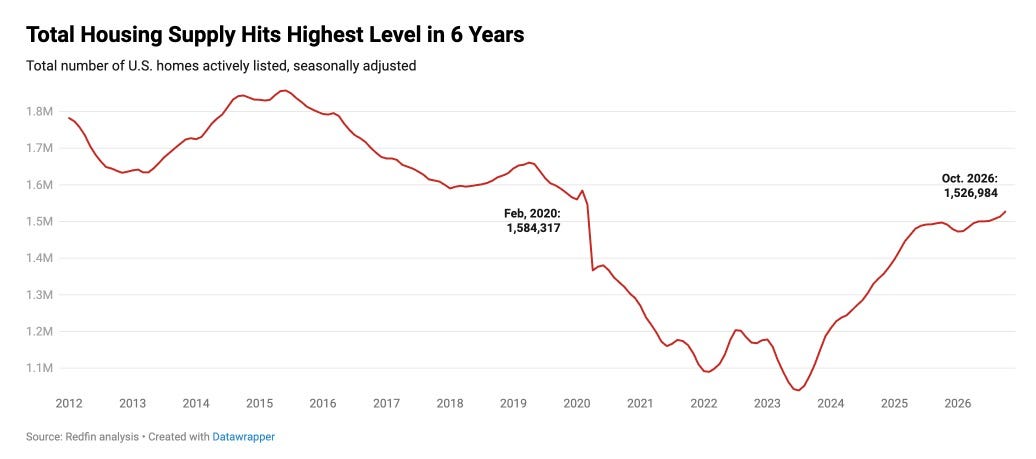
One particularly notable detail is that inventory has been rising even as new listings have softened. That suggests some of the increase is coming from homes remaining on the market longer rather than a sudden surge of homeowners deciding to sell. If economic conditions weaken and more households need to list their properties, that could add supply to a market already struggling with demand.
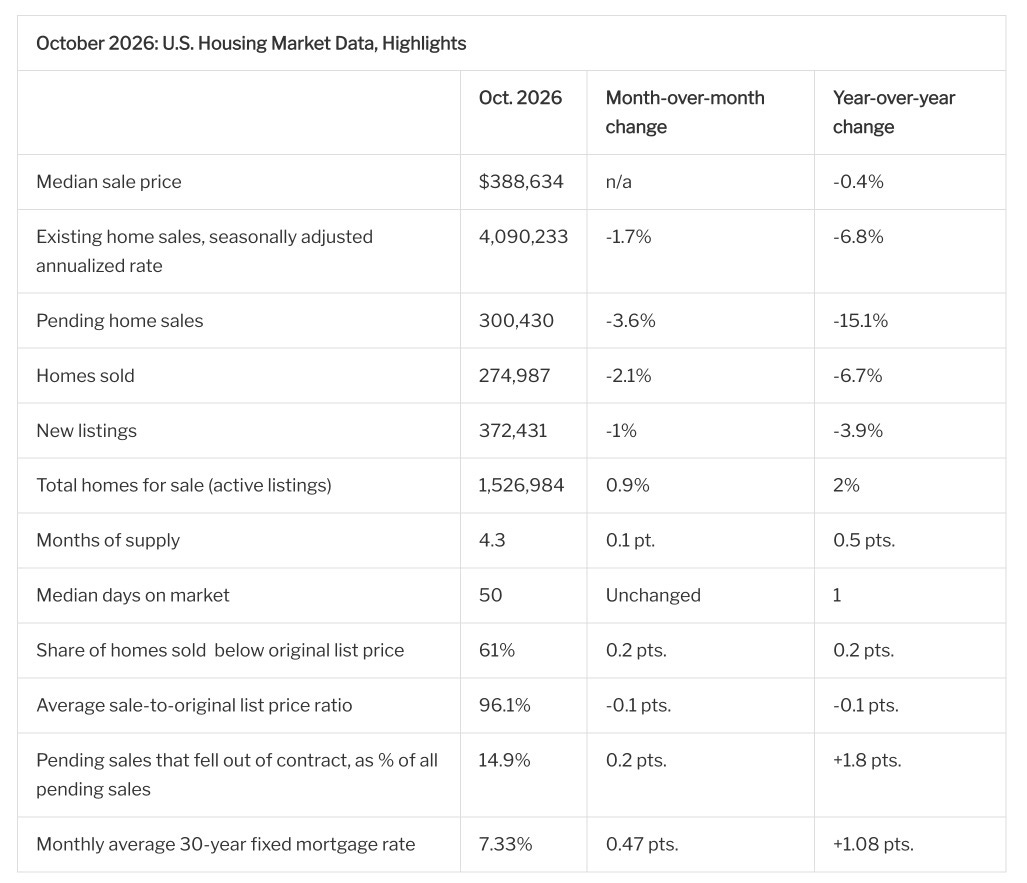
Sellers are also making more concessions. Redfin reported that approximately 61% of homes sold in October closed below their original asking prices, while 36% of sold homes had experienced at least one price reduction. Nearly 15% of pending transactions fell out of contract. Selling below an asking price doesn’t necessarily indicate a decline in a property’s underlying value, but the frequency of reductions and canceled contracts provides additional evidence that buyers have gained negotiating power.
People aren’t getting “desperate to sell”…it’s just a “record buyer’s market”, right?
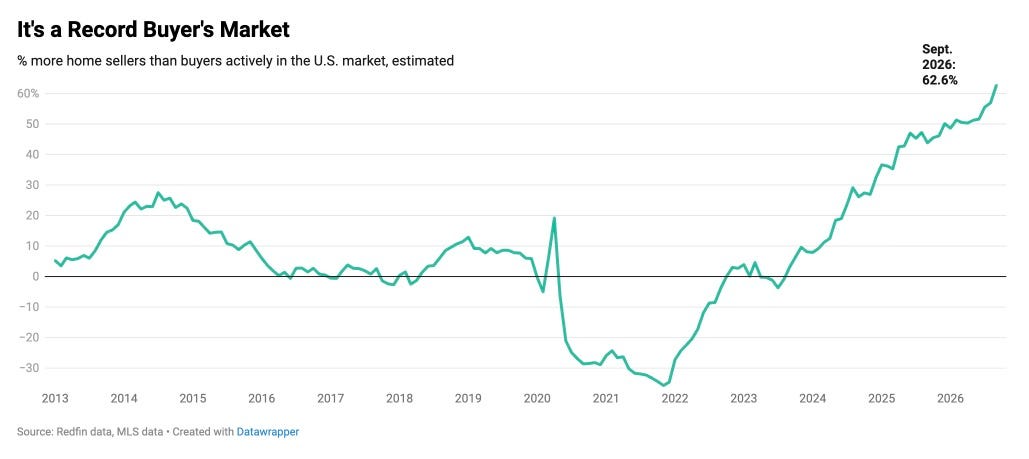
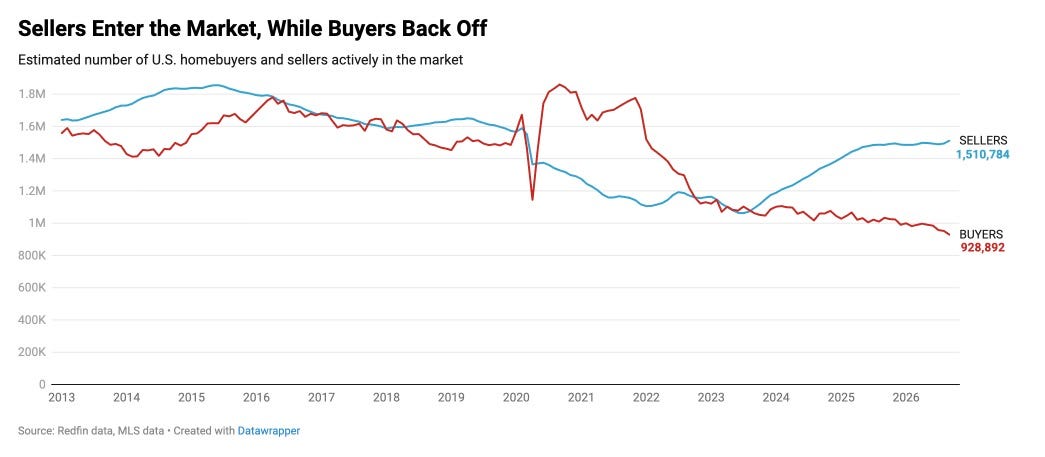
Regional data shows that some markets are already experiencing considerably larger price declines than the national average. Redfin reported year-over-year median sale-price decreases of 6.5% in Austin, 5.1% in Seattle, and 4.9% in Nashville. Pending sales also fell sharply in several large metropolitan areas, including Seattle, San Diego, and Denver. These differences matter because a national correction doesn’t have to occur uniformly. Markets with weaker employment, greater inventory growth, or particularly stretched affordability can experience substantially larger declines than the country as a whole.
Mortgage rates remain another major obstacle. According to the National Association of Realtors’ October report, the average 30-year fixed mortgage rate was approximately 7.33%, compared with 6.25% a year earlier. On a $400,000 mortgage amortized over 30 years, that difference raises the monthly principal and interest payment from approximately $2,463 to $2,750. That’s roughly $287 more per month, excluding property taxes, insurance, and maintenance.
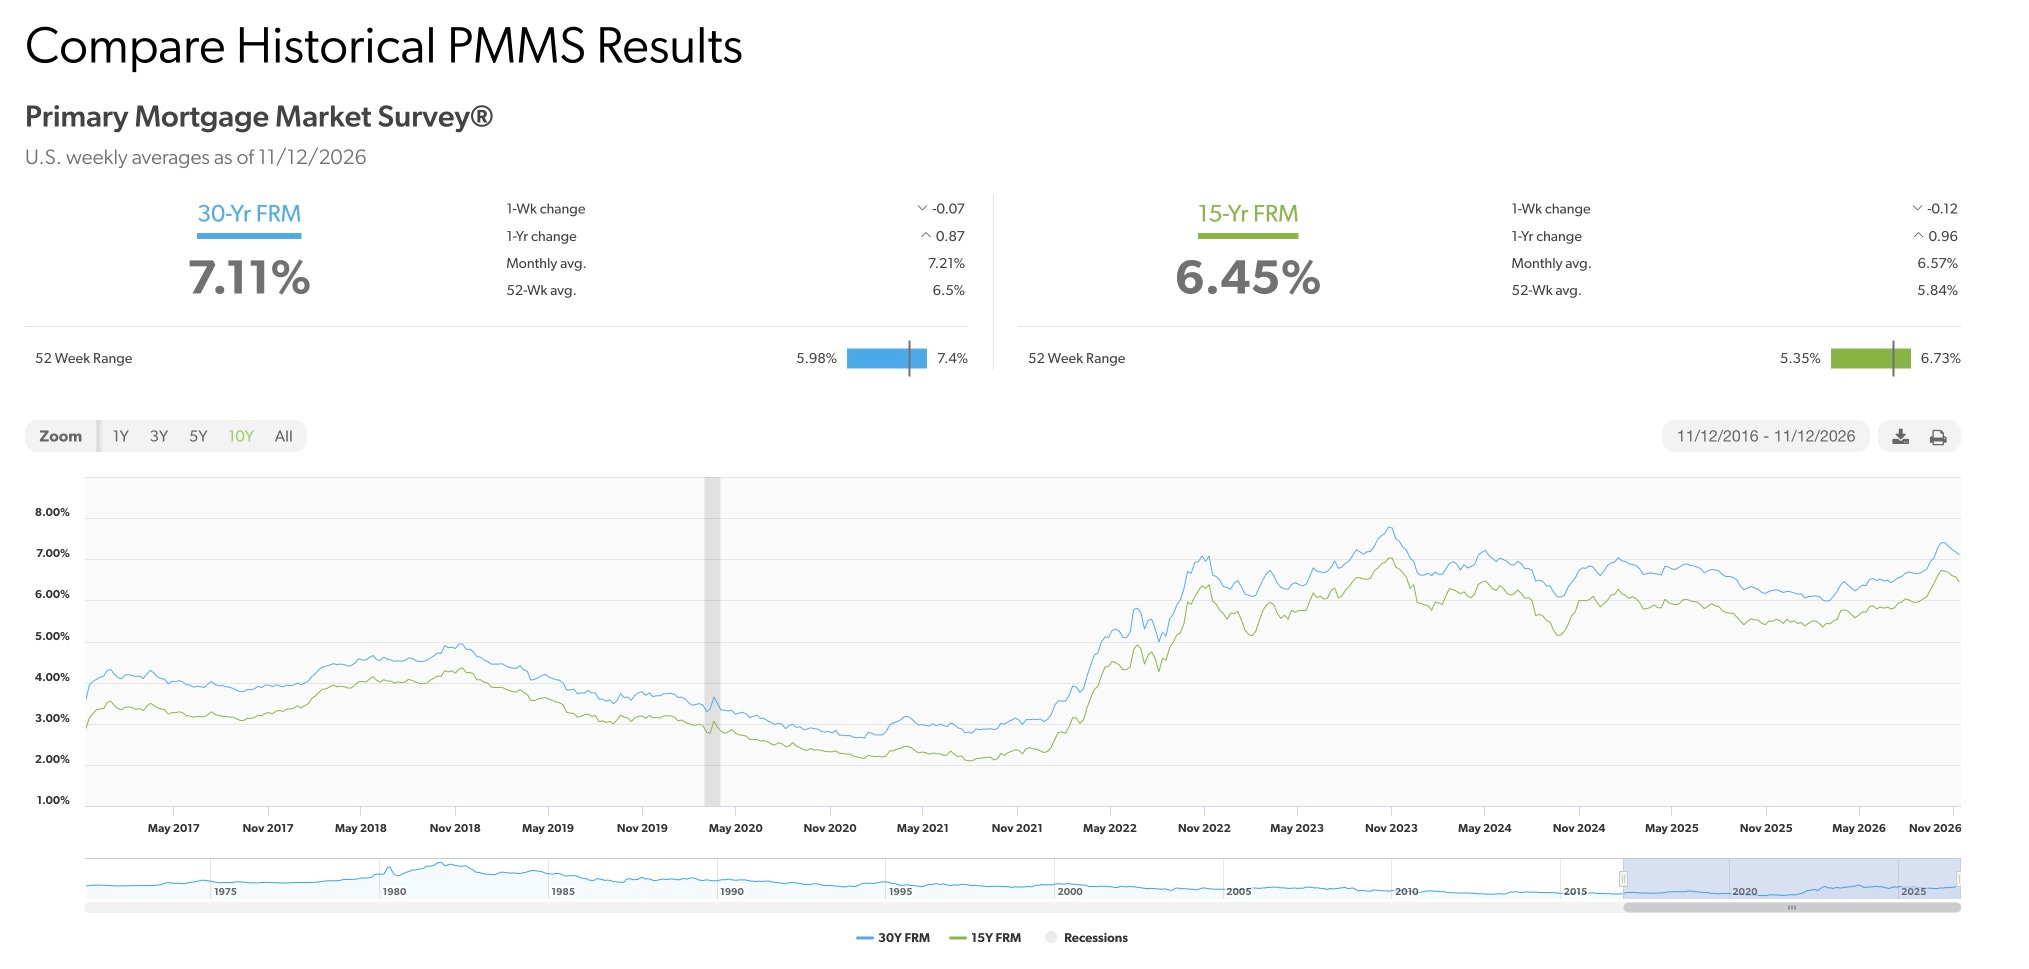
Higher borrowing costs reduce purchasing power and limit the number of qualified buyers. At the same time, homeowners with mortgages originated or refinanced at much lower rates have little incentive to move.
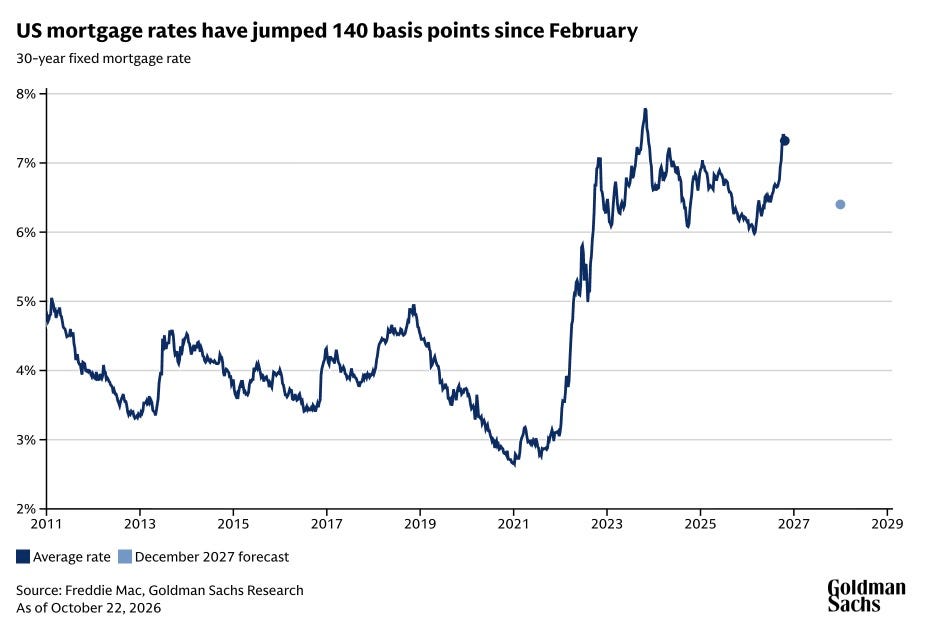
That lock-in effect has restricted supply and helped support prices, but it also contributes to low transaction volumes. If homeowners eventually need to sell because of unemployment, debt, relocation, or other financial pressures, those properties would enter a market where affordability remains difficult.
The mortgage delinquency data is worth examining because it helps distinguish a weak housing market from a potentially more serious correction. According to Intercontinental Exchange’s September 2026 mortgage report, the national mortgage delinquency rate was 3.66%. Serious delinquencies were approximately 1.04%, close to their 2017–2019 September average.
These figures remain relatively contained and don’t suggest a nationwide mortgage crisis. However, the direction of several distress indicators is less encouraging. Serious delinquencies increased approximately 21% year over year, while active foreclosure inventory rose 37%, reaching its highest level since early 2019. Completed foreclosure sales also increased 15%. Mortgages originated in 2022 or later accounted for 43% of foreclosure starts and 49% of completed foreclosure sales during September.
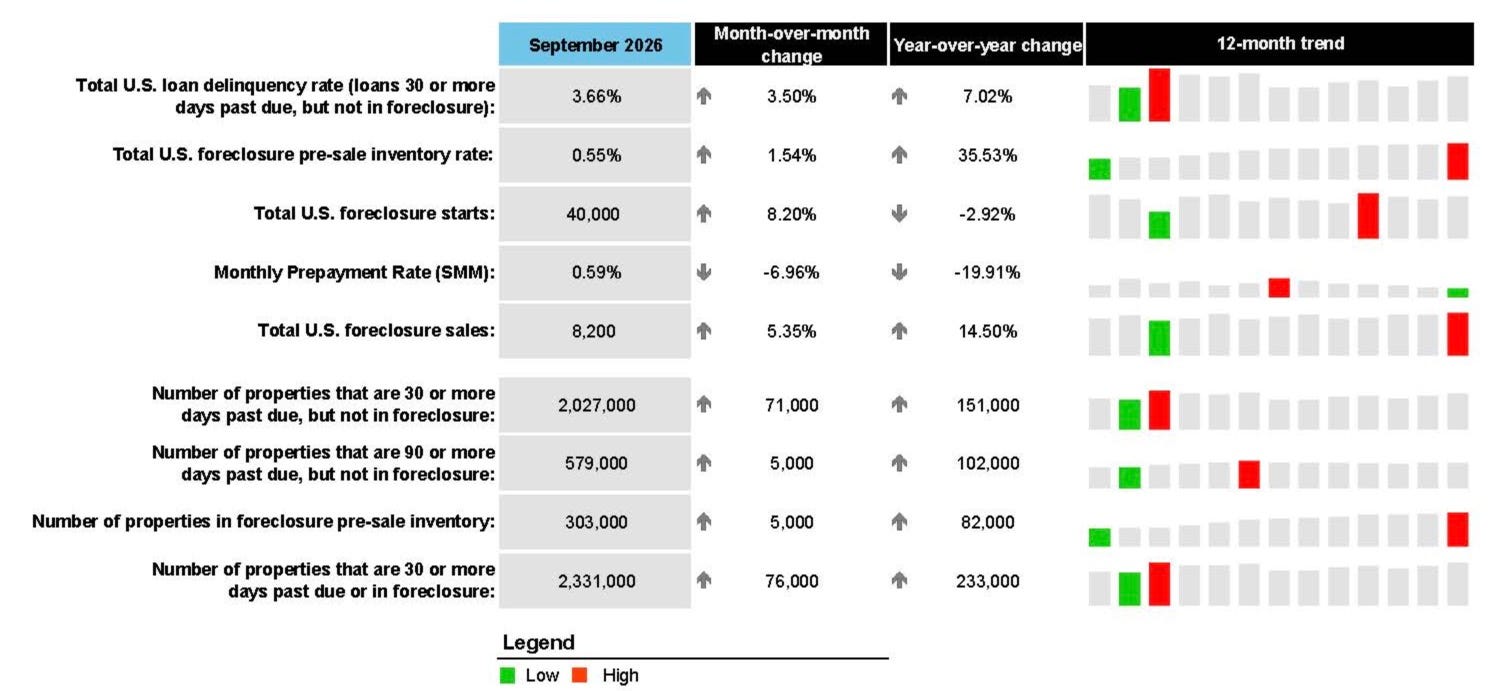
Those increases are coming from relatively low levels, which is an important qualification. Distressed transactions still represented only about 2% of existing-home sales in October, according to the National Association of Realtors. Nevertheless, the foreclosure figures suggest that financial pressure is increasing among a portion of mortgage borrowers, particularly some who purchased or refinanced more recently.
The key question for 2027 and 2028 is whether these conditions stabilize or deteriorate further. Major housing forecasters have generally projected modest national price growth rather than a crash. Fannie Mae’s third-quarter 2026 expert survey anticipated home-price increases of approximately 2.2% in 2027 and 2.7% in 2028. Goldman Sachs has also projected very limited price appreciation in 2027, with growth below 1%. These forecasts suggest a market that remains relatively stagnant, rather than one experiencing a broad collapse.
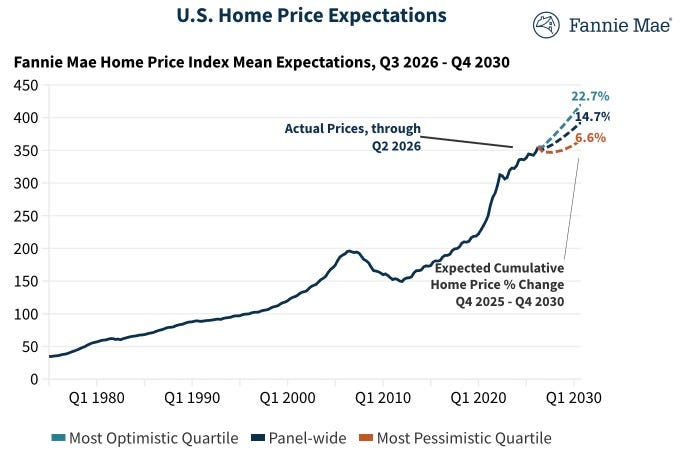
I think the downside risks to those forecasts are increasing. Housing demand is already weak, inventory is building, and mortgage distress is moving higher. A further deterioration in employment would make that combination more concerning.
Homeowners who can comfortably afford their mortgage payments have little reason to sell into a weak market, but job losses and prolonged income disruption can change that decision. More forced selling would increase inventory at precisely the time buyers are already constrained by affordability.
This is where my concerns about AI and other speculative markets become relevant. Weakness in those markets doesn’t establish that a housing correction is coming, and there isn’t sufficient evidence to conclude that this weekend’s crypto volatility is directly affecting housing.
However, a broader decline in asset values, combined with layoffs, tighter lending standards, and weaker consumer confidence, could eventually affect housing demand and household finances. Technology-heavy housing markets may be particularly sensitive to changes in employment and compensation.
There are still important reasons not to expect a repeat of 2008. Mortgage underwriting standards have generally been stronger, many homeowners have substantial equity, and a large share of existing borrowers have fixed-rate mortgages with relatively low payments. The current delinquency rate is also far below the levels associated with the worst period of the financial crisis. Those factors provide meaningful protection against widespread forced selling.
85% OFF FOREVER IF YOU SUBSCRIBE TODAY: I am again offering an 85% discount to anyone that wants to become a Fringe Finance annual subscriber today. It’s a discount you can keep and stays applied for as long as you wish to remain a subscriber: Get 85% off forever
But a housing correction doesn’t require another 2008. Prices can decline because buyers can no longer afford prevailing valuations, sellers become more willing to negotiate, and available inventory exceeds demand at current prices. A national decline of 5% to 10% over the next couple of years is increasingly plausible in my view, particularly if sales remain depressed and inventory continues growing.
A 10% to 15% decline would likely require more significant economic deterioration, while a nationwide decline exceeding 20% would probably require a much larger employment or credit shock.
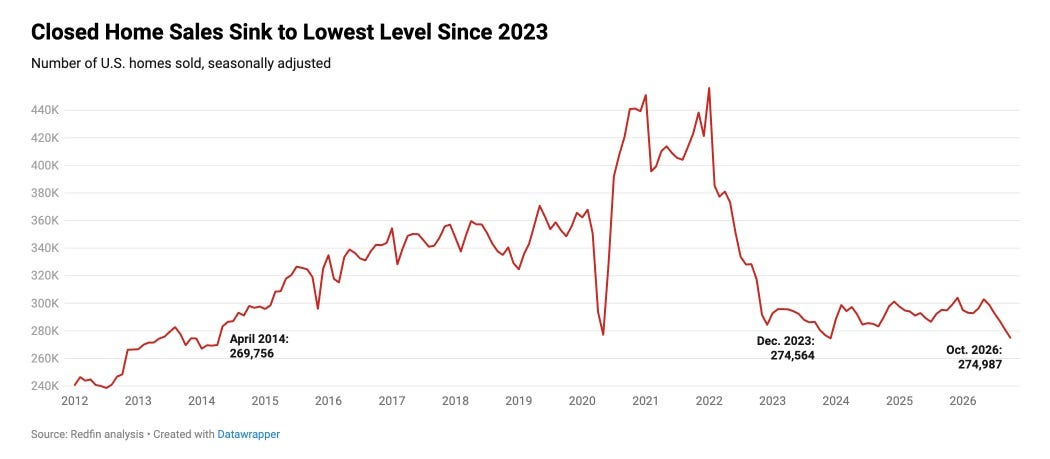
What makes the latest data concerning to me is the combination of weakening indicators rather than any single statistic. National median prices have turned slightly negative in Redfin’s data, pending sales are down double digits, existing-home transactions have fallen to levels last seen in 2010, inventory is increasing, and sellers are reducing prices more frequently. Meanwhile, serious delinquencies and foreclosure activity are rising even though overall mortgage distress remains relatively low.
I’ve warned about AI, and I continue to expect more difficult developments there. I’ve warned about crypto, and this weekend’s price action hasn’t changed my outlook. Housing is now another area where I believe the risks deserve closer attention. We haven’t reached the stage of widespread mortgage defaults or a national wave of forced selling, but several of the conditions that can precede a correction are already present.
The next phase will depend heavily on employment, household credit conditions, mortgage rates, and whether inventory continues to outpace buyer demand. If those indicators worsen together, a more substantial housing correction becomes increasingly likely. The data doesn’t yet establish that a nationwide crash is coming, but it does suggest that the housing market is more vulnerable than it was a year ago.
Now read:
- The Hidden Tech Trade In Yesterday’s FAA Chaos
- Will Nvidia Pull Guidance And Restate Earnings?
- Keep One Eye On Tech...But The Other On Crypto
- I Still Think There's More Bad News Coming
- The Seduction Of Market Bounces On The Way Down

QTR’s Disclaimer: Please read my full legal disclaimer on my About page here.