




Pimco Sees A 6% 10-Year... Here's Why "Bad Inflation" Caps Yields
Authored by Lance Roberts via RealInvestmentAdvice.com,
Will interest rates go up to 6%? That's the question on many investors' minds since Pimco's chief investment officer, Dan Ivascyn, told the Financial Times last Friday that a 6% 10-year Treasury yield is "certainly possible." This week's hotter-than-expected September CPI report only added fuel to that argument.
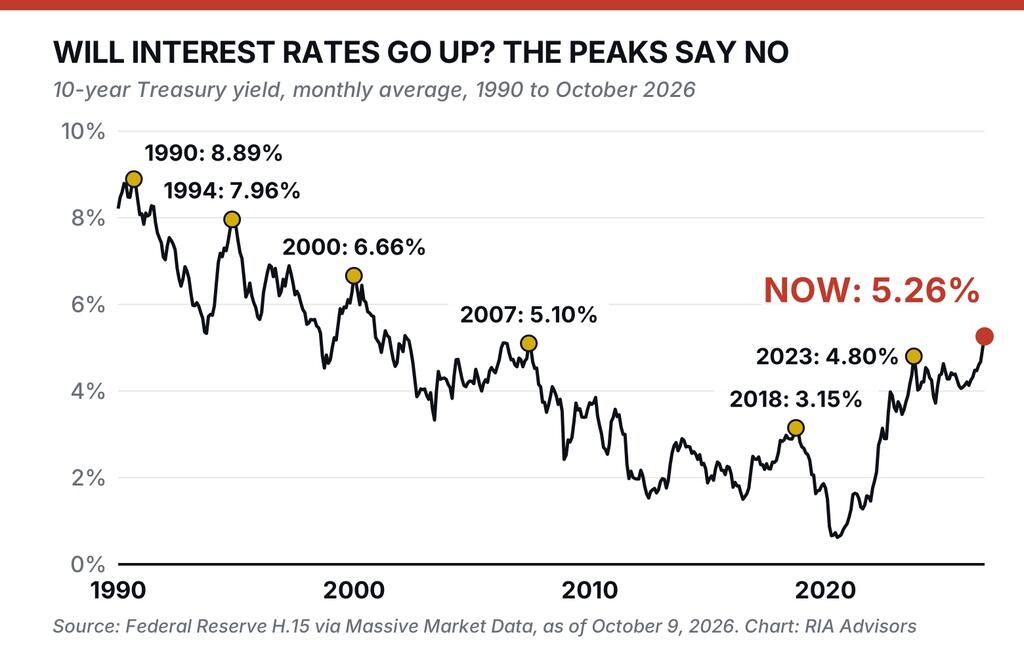
I get it. The 10-year closed at 5.31% on October 5, the highest close since May 2002. It started the year at 4.18%. However, look at what is actually driving inflation. Then look at how every major yield spike since 1990 ended. The case for a sustained move to 6% gets thin quickly.
Pimco's 6% Call, And Why It Landed
In case you didn't read the article, let's start with what Ivascyn actually said, because the headlines compressed it. He did not forecast 6%. He said it was possible, and he tied a big part of the recent move to market plumbing rather than economics.
"It is certainly possible, even from a short-term trading perspective... some of the activity we've seen in the last couple of weeks is tied to some negative technicals." - Dan Ivascyn, Pimco, to the Financial Times, October 9, 2026
Furthermore, he also flagged "stop-out activity from the platform hedge funds and other levered investors," and warned that a move to 5.5% or higher would bring "some decent weakness in risk markets, both credit and equity."
Read that last part twice, because I'll come back to it, and it was a topic we touched on when we discussed the "Basis Trade." The backdrop is real. Oil has spiked. The Fed raised rates in September for the first time since 2023. And today's CPI showed headline inflation accelerating to 3.7% from 3.4% in August.
Such is the setup that makes a 6% call feel inevitable. But a forecast that depends on forced selling by levered funds is a forecast about positioning, and positioning reverses. When the "technicals" that drove a move wash out, the fundamentals reassert themselves. So the real question for investors is what the fundamentals say.
Will Interest Rates Go Up On Inflation? Look Under The Hood
The bond bears' case rests on inflation. So let's look at inflation. The Bureau of Labor Statistics reported this morning that the energy index rose 20.4% over the past year, with gasoline up 34.2%. Gasoline alone rose 9.1% in September. Strip out food and energy, and core CPI rose 2.6% over the year. A year ago, that same core rate was running at 3.0%.
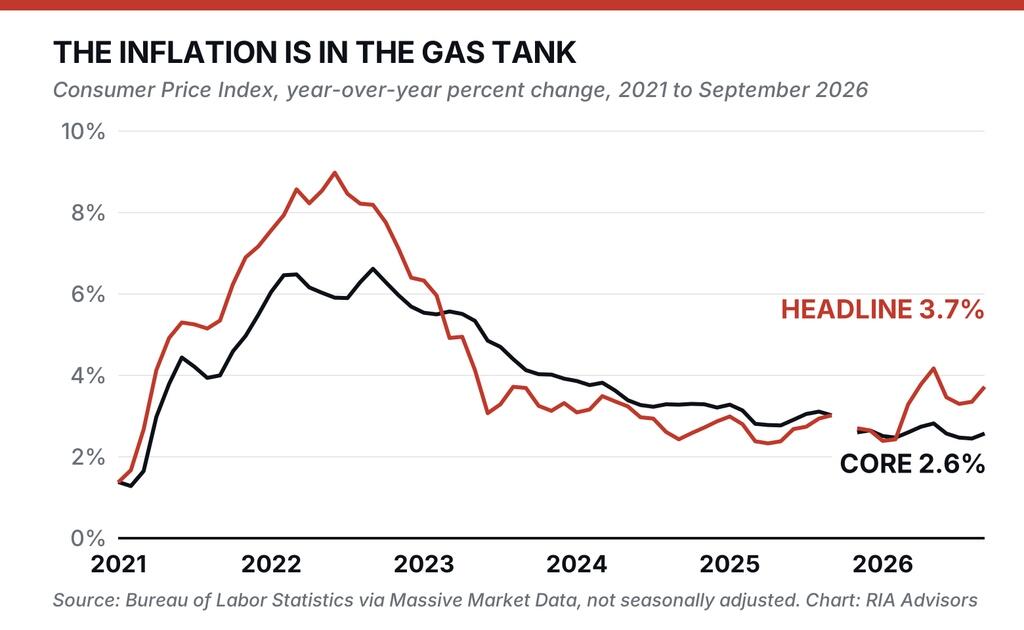
Notice in the chart above that the red and black lines diverge in March 2026. That is the oil shock, and it hasn't spread into the core. Wages tell the same story. Average hourly earnings rose 3.0% over the past year, per the September jobs report, which is hardly a "wage-price spiral." Employers added just 29,000 jobs in September, and July was revised to a loss of 10,000.
Is this the kind of inflation that sends yields to 6% and keeps them there? No. This is "bad inflation," the supply-shock variety that eats into household budgets until spending slows, hiring stalls, and the very price pressure that started the scare begins to fade on its own. It doesn't justify "higher for longer" forever. Gasoline now runs $4.33 a gallon nationally, up from $2.98 before the current oil shock (AAA data cited by CBS News). That extra $1.35 per gallon isn't spent elsewhere, and the economy slows under its weight. Energy-driven inflation without wage growth behind it is a tax on consumers, and taxes slow economies. Slowing economies don't sustain 6% bond yields.
Every Yield Peak Since 1990 Ended The Same Way
Bob Farrell's Rule #1 is that markets tend to return to the mean over time. Bond yields are no exception, and when I went back through the Federal Reserve's daily Treasury data and pulled every major 10-year yield peak since 1990, 6 of them stand out, and each one looked unstoppable at the time.
Here are the details of that research. The table below uses the daily closing high for each episode, then measures where the yield sat 12 and 24 months later. It also lists what was happening as yields fell, because yields rarely fall for "positive" reasons.
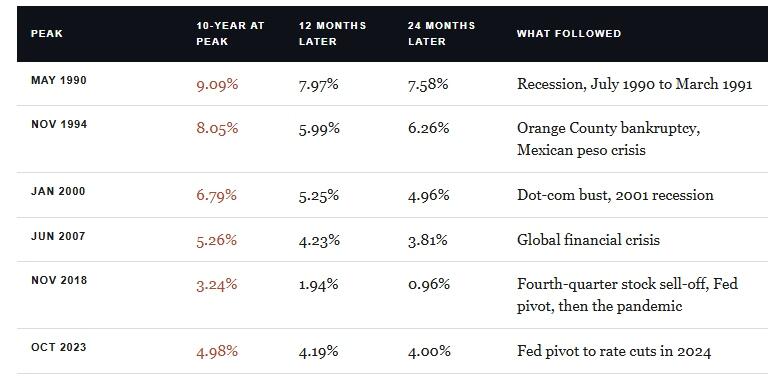
Step back for a moment and think about the data. Since 1990, there have been 6 interest rate peaks, and 6 periods of lower yields two years later. The mechanism was the same each time: higher rates tightened financial conditions until something gave, whether that was the economy, a levered corner of the market, or the Fed's resolve. The average decline was 1.64 percentage points, within a range of roughly 1 to 2.25 percentage points.
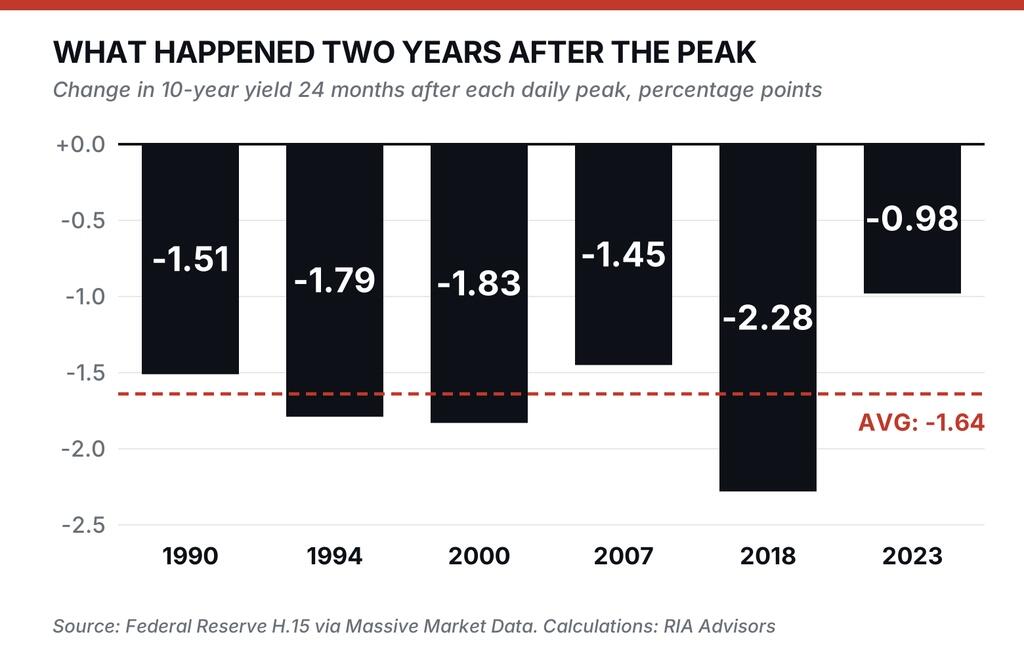
There are two caveats to mention. The first is that a peak is only a peak in hindsight. This study tells you how these episodes resolved, not the day they ended. Secondly, the 2018 figure includes the pandemic collapse in rates, which flatters it. Still, even 12 months out, every case was lower, by more than three-quarters of a point at minimum. So, will interest rates go up from here? They can, for a while. The history says that the higher yields climb, the faster they break the thing that is pushing them higher.
"Yields don't peak because investors get comfortable. They peak because something breaks, and at 5.3% the list of candidates is getting long."
Real Rates Are Already Doing The Fed's Work
This is where the data gets even more interesting. When we measure against core inflation, the 10-year Treasury now pays a "real yield" of roughly 2.7%. That's the highest since 2010, and well above the 1.6% average since 1990. Real yields are what borrowers actually feel, regardless of what the "soft landing" crowd says. A business deciding whether to build a plant is weighing that number, just as much as a family deciding whether to buy a house. This is why if you are wondering whether interest rates go up from here, you should watch "real yields" closely.
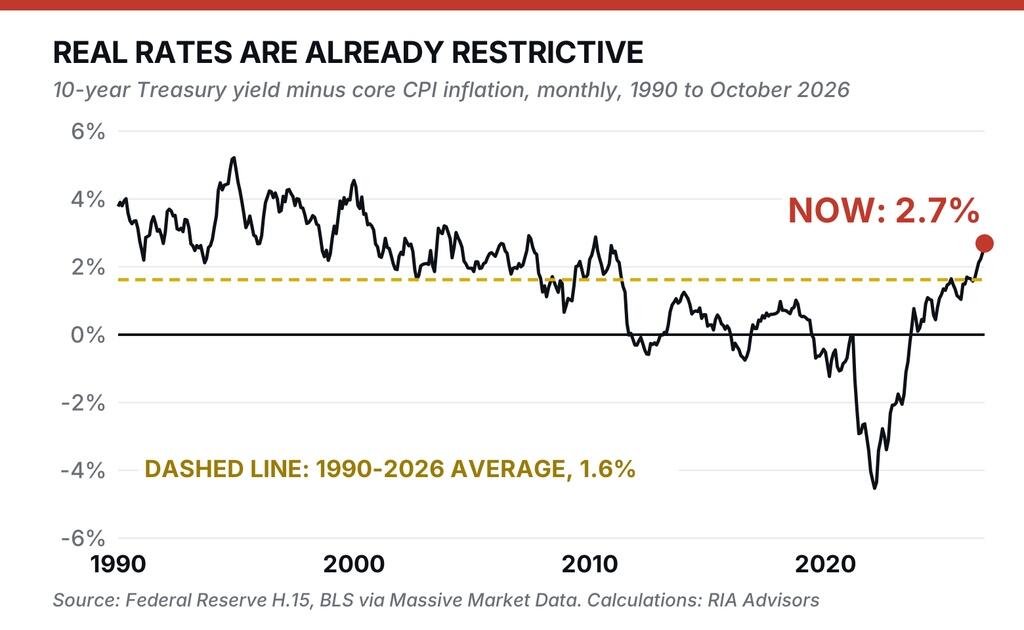
I've written about where I thought fair value sat for some time. To wit:
"By the mean-reversion logic the framework implies, the fair value of the 10-year is closer to 5.3% than to 4.6%." - Rising Interest Rates: Why The Narrative Fails Against The Data, May 22, 2026
Interest rates have already returned to normal, and a move to 6% would be an overshoot of roughly 70 basis points beyond fair value. That level would also arrive just as payroll growth has nearly stalled and unemployment has climbed to 4.2%.
"But Lance, the debt is far bigger now than in any of those past episodes."
I agree, and it certainly is. That is exactly why the overshoot is harder to sustain, not easier, because every extra point on the 10-year eventually rolls into the interest bill on the trillions of dollars of debt that Washington refinances every year. The CBO's preliminary numbers show net interest on the public debt hit $1.143 trillion in fiscal 2026. That's up 11% in a year and accounts for about 21% of all federal receipts.
Higher rates on a bigger debt pile drag on growth. That drag eventually shows up as lower yields, not higher ones. I made that case in detail in "Normal Interest Rates: What The Debt Panic Gets Wrong."
Will Interest Rates Go Up Further? What It Means For Investors
Go back to the line I asked you to remember. Ivascyn's own scenario says a move to 5.5% or higher brings "some decent weakness in risk markets, both credit and equity." That is precisely the environment in which high-quality bonds tend to do their job. If rates spike far enough to hurt stocks and credit, the spike itself often sets up the bond rally. In other words, the 6% scenario partly contains its own cure.
That doesn't mean loading up on long-duration bonds and walking away. In this past weekend's Bull Bear Report, we noted that we've slightly shortened clients' bond duration. Overall bond allocations remain in place. The trade-off is plain: duration protects you in a growth shock, when yields fall and bond prices rise, but it hurts you in an inflation shock, when yields keep climbing and longer bonds take the most pain.
If you are drawing income from your portfolio, a 5% yield is also a real cushion. It helps against the sequence of return risk I covered last week.
For the full case on owning Treasuries at these levels, see "Bonds At 5%: Is The 10-Year Treasury Finally A Buy?"
Waiting for 6% before doing anything is a bet in itself. Every peak in the table above looked like it had more room to run at the time. Whether interest rates go up another half point or roll over next month, a few basics hold. Know your portfolio's duration and whether it matches your time horizon. Staggering maturities means you're never forced to bet everything on one rate call. And if an oil-driven second wave would damage your plan, some inflation protection earns its keep. Such is the difference between managing risk and forecasting it.
Bottom line:The 10-year could touch 6% on forced selling, but with core inflation cooling and growth stalling, 6% looks far more like the top of this cycle than a new floor.
Every one of the last six yield peaks felt like the start of something new. Each one turned out to be the end of something old. The only question is what breaks first this time.