Why Are Markets Rallying?
Welcome to MktContext! I am a professional money manager, trader, and investor who has been timing and beating the market for over a decade. We specialize in predicting market direction by studying the economy and market signals. Join 8,000 subscribers at MktContext.com in improving your portfolio returns — it’s free!
Macro economy
The highlight of this week was the econ data. GDP growth printed negative for the first time in three years, which caused SPX to gap down… only to be bought back up the rest of the day. This is a huge clue when the market can’t sell off on bad news — it tells us that a lot of pessimism is already priced in.
Note that the weak GDP reading was entirely related to front-loading which we covered in past posts; especially gold imports which weighed on GDP calculations. In actuality, consumption was better than expected at 1.8% annual growth. Sales to private domestic purchasers (which excludes exports and government spending noise) rose by 3%.
Friday’s employment growth printed positive and beat expectations. Despite all the concerns about business uncertainty, there’s still is no sign of mass layoffs. This is impressive as CEOs have been in stasis, and you would think cutting personnel costs is the obvious reaction to preserving profitability. All of this means that investors can plausibly believe that a recession will be avoided, even if sentiment has taken a big hit.
For example, the CFO of Bank of America said they do not believe there will be a recession in 2025. These guys have front-row seats to America’s bank accounts and loan delinquencies, and they’re telling us that defaults remain low while consumer spending is still rising. The delayed impact of tariffs means that the immediate econ data is still resilient.
So how do you trade or invest in the meantime? Do we position for a recession now or wait for better levels? It is tempting to front-run the recession, but even if there is a recession, things can look stable for several months before the eventual collapse. For example in 2007, it was extremely obvious that the financial system was wobbling and yet stocks remained resilient for another year.
When it comes to market timing, being early is equivalent to being wrong, especially on the bear side. The recession may come one day, but today is not that day. Like we said last week, you don’t want to be short a rising market, screaming: “It’s supposed to be a recession!”. The bear thesis appears to be played out (for now) and the technicals have turned bullish. Unless we get a meaningful deterioration in jobs data, now is not the time to be betting on recession.
Why are markets rallying?
The SPX is coming off one of its best 9 day streaks and a lot of investors are in disbelief. “Isn’t there supposed to be a recession? Aren’t we in a trade war?” This is not how markets work.
Markets price in all current news and future expectations. We had a load of bad news in Feb as earnings were revised down on DOGE cuts and the economy slowed. As we wrote then, the recession wasn’t guaranteed but the odds were creeping up. Coming off an overheated rally, the SPX declined -10% as it priced in this slowdown.
Then came Liberation Day tariffs, which drove the market to price in a proper recession. SPX dropped another 14% from that date. But since then, the news has been stalling, not getting worse. Bear markets need worsening bad news to continue selling off. Instead, we got resilient econ data points despite ample fear and negative sentiment. Tariff talk cooled off as countries came to the negotiating table and Trump announced delays and exceptions. Even China looks ready to negotiate now.
The lesson for market timers is to not anchor on the narrative once it is mainstream. The pending recession was news up until the point that it became fully expected by the market (betting odds went up to 70%!). Instead, we focused on technical indicators that told us the market was, counter-intuitively, moving up — more on this later. Since mid-April, we started buying the dip even as headlines were dizzying. It is during these times of max pain that we get great investment opportunities.
Bullish technical signals
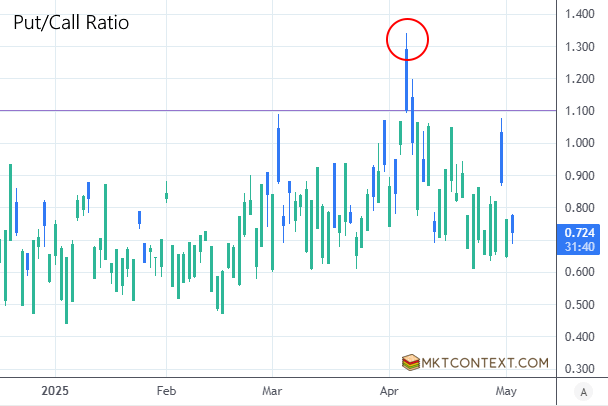
So what were the bullish technical signs that told us to buy into the jaws of a recession/meltdown? Firstly, our most trusted indicator, the Put/Call ratio which measures demand for downside hedges. It spiked to 1.35 on Apr 4th; anything above 1.1 is panic territory. More importantly, successive spikes were “lower highs” indicating that the panic was not cascading further.
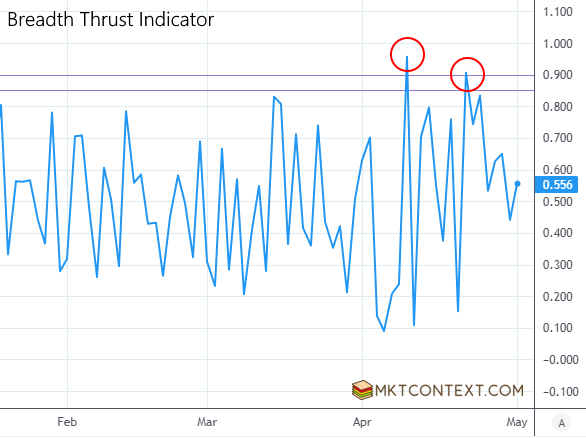
Next, we got breadth thrusts on Apr 9 and Apr 22, with >90% of NYSE volume traded to the upside. In fact, the Apr 9 reading was >95% which hasn’t happened in nearly 15 years. This was the day Trump announced a 90 day pause on reciprocal tariffs, and was the first glimmer of hope in the trade war. Breadth thrusts occur when widespread buying interest enters the market, usually triggered by a strong shift in direction.
This past Weds we got awful econ data (negative GDP and job growth cut in half). SPX gapped down, retested the 5500 range high, and shot straight up the rest of the day. When market expectations are already so bad that further bad news doesn’t cause a selloff, that is how you know we’ve reached max pessimism. This is called “bad news good price” and is a key indicator of major turning points.
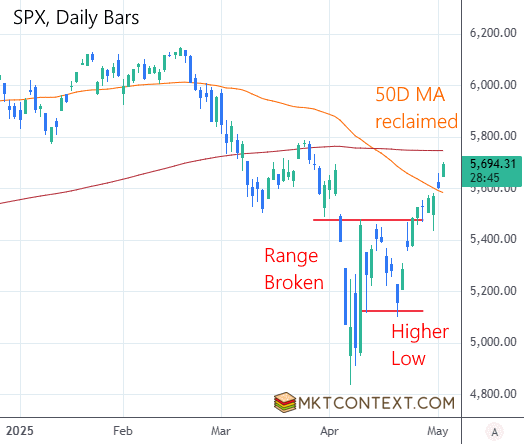
From a charting perspective, several pattern clues tell us that the bottom is formed in SPX. First, we broke out of the 5100-5500 trading range (red horizontal lines) and held on Weds’ retest. The market tried to sell off on Apr 21 but formed a “higher low”, meaning it didn’t get as bad as the first dip. Then this week, the market reclaimed the 50-day moving average (orange curve) which is often a point of resistance. Note that the powerful 200-day average still looms ahead.
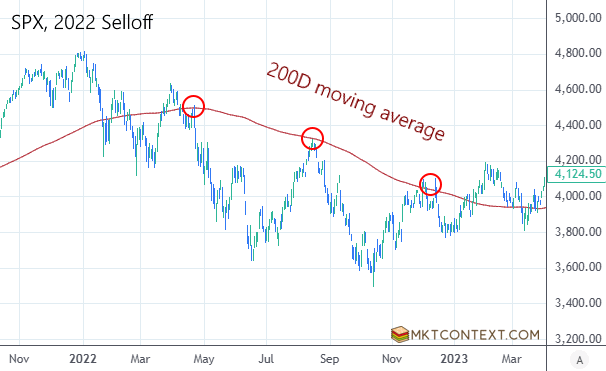
The only thing that gives us pause is the 200-day moving average overhead resistance (dark red curve on above chart). The 200-day is often strong resistance stopping rallies in their tracks, as it did on March 25. Also recall in the 2022 bear market, it perfectly resisted buyers at every touch (red circles below). SPX is likely to test this line again this week, and with the FOMC meeting on Weds, there could be fireworks. We’ll monitor closely.
To see our portfolios and get more market timing content, head over to MktContext.com and subscribe today!