The Untold Story Of Inflation
What’s behind the numbers?
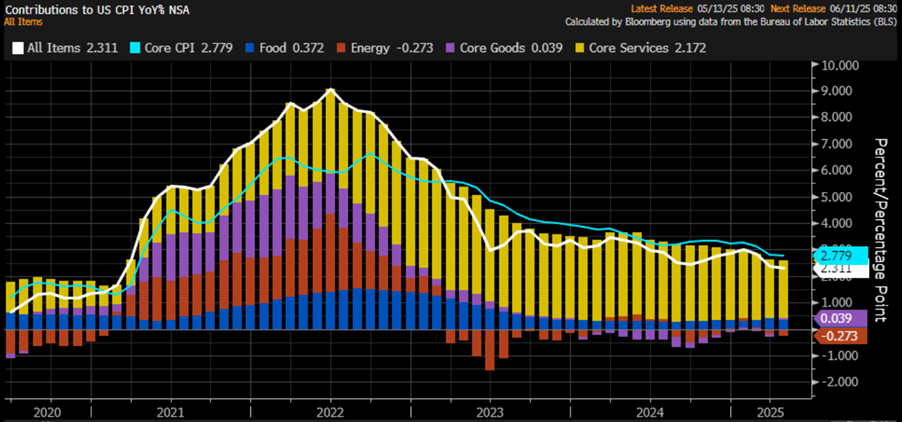
The fourth U.S. CPI release of this Jubilee Year rolled in with a modest +0.2% month-on-month rise—below the +0.3% forecast and a bounce from March’s miraculous -0.1% dip. Year-on-year, inflation clocked in at +2.3%, just shy of the +2.4% expectation and a tick down from March’s +2.4%. Energy kept playing the deflation hero, goods stayed in their deflationary funk (just a little less gloomy), food prices took a breather, and services delivered their smallest monthly increase since the ancient times of December 2021. All in all, a Goldilocks report… if you squint hard enough.
Core CPI rose by 0.3% month-on-month in April, beating expectations of +0.2% and up from March’s +0.1%. On a year-on-year basis, core CPI climbed 2.8%, exactly in line with forecasts and unchanged from March, once again marking the lowest annual increase since March 2021. Core services—which make up a hefty 76% of the core CPI—eased slightly from +2.79% to 2.73% YoY, while core goods turned inflationary year-on-year for the first time since December 2023. And for the trivia lovers: this marks the 59th straight month of rising core CPI. But hey, who’s counting?

A glimmer of hope for those still clinging to the “inflation is over” narrative: Owners' Equivalent Rent—the inflation metric that just won’t quit—rose only 4.3% year-on-year in April. That’s down a hair from March’s 4.4% and the “coolest” it’s been since March 2022. So yes, inflation is definitely vanquished… if you squint hard enough.
Even more “encouraging” for the inflation-is-dead crowd: SuperCore CPI—core services minus housing—rose just 2.74% year-on-year in April, down from 2.86% in March and hitting its lowest level since February 2020. Break out the confetti, right? Never mind that it’s still well above anything resembling “mission accomplished.” But hey, why let stubbornly sticky data get in the way of a good FED victory lap?
Thoughts.
April's CPI report – the first one since the grand 'liberation day' – has confirmed what we all secretly knew: March's deflationary blip was nothing more than a statistical hiccup. Apparently, American consumers and businesses have already felt the first delightful aftershock of the ongoing trade war between the U.S. and China. Welcome to the 'Trump-Re-Flation' era, where under the shiny new trade policies, someone’s got to foot the tariff bill – either consumers or producers, take your pick! So, while the ‘Manipulator in Chief’ and the ‘Central Banker in Chief’ are busy congratulating themselves on their brilliant victories, the cold hard truth remains: the umbrella inflation index is up 3.38% YoY and still climbing since the ‘Disruptor in Chief’ took office. And guess what? That elusive 2% target? Still a fantasy.
US Umbrella inflation Index (Average of CPI; Core CPI; PPI; Core PPI; Core PCE, 1-year consumer inflation expectations)
Rather than clinging to the fairy tale that 2% inflation is just around the corner (before the end of the Jubilee Year—give or take a miracle), savvy investors, clearly more grounded than the army of PhDs at the Fed and on Wall Street, know better. Especially with that “most beautiful word in the English language” (tariffs, of course) still waiting to hit consumer wallets like a delayed punchline.
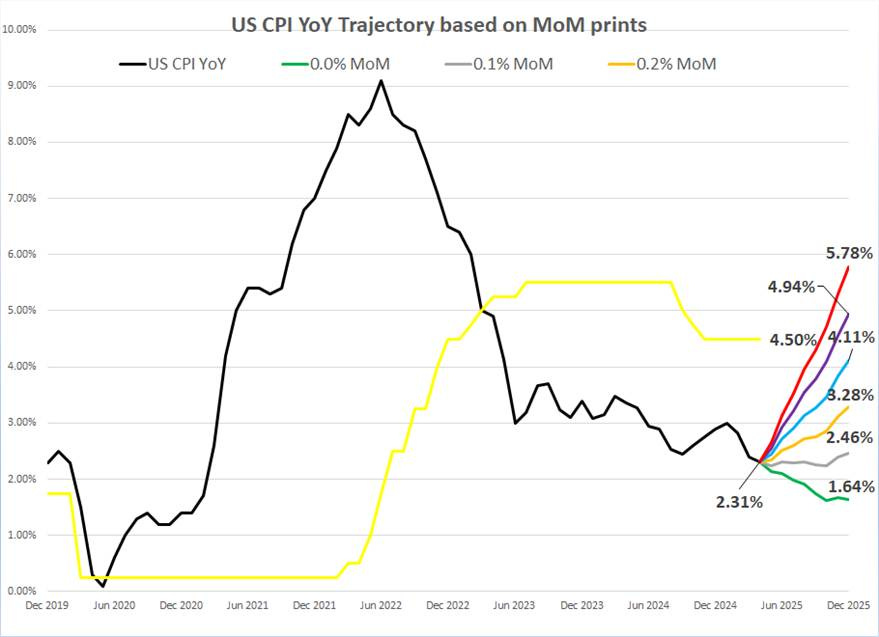
Anyone with a passing familiarity with base effects can do the math:
To hit 2% by end-2025, CPI would need to tiptoe in at under 0.1% monthly—basically a statistical unicorn.
If monthly prints creep up to 0.2% or more, we’re looking at year-end CPI anywhere between 2.46% and 5.8%.
In that case, the FED may have to sheepishly admit that easing policy during an inflationary boom wasn’t exactly a masterclass in central banking—unless the goal was to win the partisan policy limbo contest.
Rather than clinging to those outdated and downright absurd inflation theories, savvy investors – the ones who actually understand the business cycle, across centuries and continents – know that inflation always boils down to three basic causes: shortages, demand, and lack of confidence.
So, with this in mind, tariffs, trade wars, and the U.S.'s increasingly imperialistic antics are only going to make shortages worse and chip away at global confidence in public institutions – first abroad, as well as in the US. Let’s face it: the economy will always be the most important factor in government approval. Trump will lose support in a heartbeat if his tariffs spark inflation, and if he dares to drag Americans back into the Middle East to fulfill his colonial ambitions, he can kiss his approval ratings goodbye.
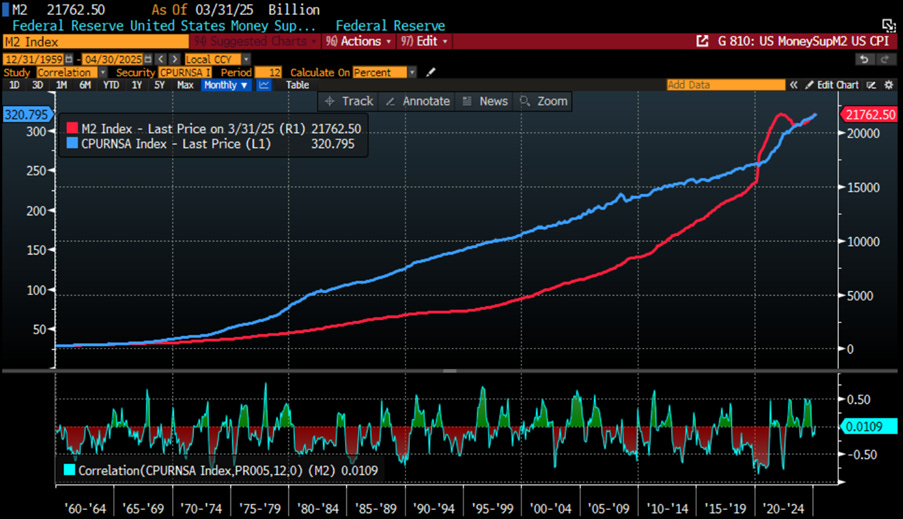
The Keynesians, who have been tirelessly pushing their totalitarian Malthusian agenda as if it were a natural extension of American imperialism, have spent years – and continue to – argue that inflation is all about the expansion of the money supply. They cling to this theory as though it's some kind of universal truth, despite the inconvenient fact that reality has a way of proving them wrong.
The people pushing this theory clearly haven’t travelled much. Currency inflation happens in two ways: First, when a currency drops in value, it draws in foreign capital, like when the British pound hit $1.03 in 1985 – it was like the UK was on sale for Americans. Second, if a British buyer purchases a U.S. property for $10 million, they convert pounds to dollars, increasing the domestic money supply without the central bank lifting a finger. Still sceptical? Check the correlation between the U.S. M2 money supply and the CPI – it’s about as consistent as a broken clock.
US CPI Index (blue line); US Money Supply Index (M2 Index) (red line) & Correlation.
Savvy investors who rely on market data, not government propaganda, know that the true indicator of inflation isn’t CPI – it’s the Gold to Bond ratio and how it stacks up against its 7-year moving average. And surprise, surprise, when you compare the Gold to Bond ratio with M2’s yearly change, there’s zero significant correlation. But hey, who needs data when you’ve got a good story?
Upper Panel: Gold to US Bond Ratio (blue line); 7-Year Moving Average Gold to US Bond Ratio (red line); Lower Panel: US Money Supply (M2 Index) 12-Months Rate of Change (yellow histogram).
A quick glance at capital flows during the Great Depression reveals a massive capital exodus in 1931, triggered by the Sovereign Debt Defaults of that year. Every major European country, including Britain and its Commonwealth (hello, Canada), suspended debt payments. That, my friends, is what took down 9,000 banks, not tariffs.
Looking at the losers in financial market history, we can see the 1987 crash was driven by capital outflows, just like the 1989 Japanese Bubble, which mirrors the 1929 U.S. bubble. In both cases, global capital inflows concentrated in specific assets, driving prices up and flooding the economy with money. Funny how history seems to repeat itself, right?
After Japan's 1989 bubble burst, capital shifted to Southeast Asia, with Thailand's real estate and stocks skyrocketing – until it all crashed in 1997. By 1999, capital was already eyeing the next big market. Thailand’s peak was mirrored by the U.S. market rising into 1998. In response to the 1997 Asian Currency Crisis, Thailand passed laws restricting foreign land ownership. Foreigners now can't own land outright, but can invest significantly in certain sectors, like with the 2022 proposal allowing land purchases with a 40-million-baht investment. Foreigners can own up to 49% of condo units, provided the money is foreign-sourced, boosting the money supply. They can also lease property for 30 years, with potential renewals, but no ownership. While setting up Thai companies to hold land is a workaround, it's closely monitored. Recent talks focus on easing restrictions for high-value investors, continuing Thailand’s trend of regulating property investments in response to capital concentration and shifting markets.
Thai Set Index in Thai Baht from 1989 until 2002.
For those tracking gold prices against different currencies, you’ve probably noticed that gold’s price isn’t the same everywhere – it’s all about the currency value. The big question for investors is: Are you actually looking at a chart of gold, or are you just staring at it through the lens of your local currency like a confused tourist at a souvenir shop?
Price of Gold in USD (blue line); CNY (red line); EUR (green line); JPY (Yellow); CHF (purple line); GBP (grey line); IDR (orange line) rebased at 100 as of December 31st 1999.
When it comes to demand-driven inflation, Keynes' theory was seriously off the mark. He assumed that the bull market leading up to 1929 was entirely fueled by domestic demand and suggested raising interest rates to curb borrowing and lowering them to encourage it. What a narrow view! He totally missed the impact of capital flows. Higher interest rates, as Volcker proved in 1981 by cranking them up to eye-watering levels, can actually attract capital – just look at how the dollar soared to a record high in 1985. In 1927, the FED lowered rates to try and deflect capital back to Europe, but that didn’t work. They raised rates from 3.5% to 6%, and it did nothing to stop the market rally. Then, in 1931, they slashed rates to 1.5%, and surprise, that didn’t help either. So, here we are, stuck with failed theories that people with zero international experience continue to parrot just because "everyone else is doing it."
 Asset inflation happens when there's either a shortage or oversupply. Take the California Gold Rush in 1849 – gold flooded the market, and the purchasing power of gold dropped like a rock. During inflation, assets soar, and money loses its value, and guess what? Money has never been constant. Those shouting "fiat" just don’t get it – money's always gone up and down in value, regardless of whether it’s paper or gold. History is full of fiscal irresponsibility, long before paper money. Even under a gold standard, inflation and deflation popped up. Just look at the Gold Rush – the New York Tribune's Bayard Taylor was stunned by the absurd inflation he saw. Hotel rooms rented for $10,000 a month (about $300,000 today) – for gamblers! Gold was so abundant in California that goods inflated locally, but not in New York. It was basically the Tulip Bubble of the West Coast.
https://www.pbs.org/wgbh/americanexperience/features/goldrush-california/
Read more and discover how to trade it here: https://themacrobutler.substack.com/p/the-untold-story-of-inflation
If this research has inspired you to invest in gold and silver, consider GoldSilver.com to buy your physical gold:
https://goldsilver.com/?aff=TMB

Disclaimer
The content provided in this newsletter is for general information purposes only. No information, materials, services, and other content provided in this post constitute solicitation, recommendation, endorsement or any financial, investment, or other advice.
Seek independent professional consultation in the form of legal, financial, and fiscal advice before making any investment decisions.
Always perform your own due diligence.


