
Eyes Wide Shut Fed…
What’s behind the numbers?
As expected, the Federal Open Market Committee hit snooze for the fourth straight meeting, keeping rates cozy at 4.25%–4.5%. Powell and friends basically said, “Let’s just see what happens,” as they squint at the data like it’s a magic 8-ball. With war chaos and tariff tantrums piling on, the Fed’s current strategy seems to be equal parts patience and crossed fingers.
As expected, the tariff circus stole the spotlight in the Fed’s latest economic projections and press conference, with officials grudgingly updating their forecasts to reflect what everyone else has been whispering: stagflation is knocking, even if no one at the Eccles Building wants to say the S-word out loud.
Growth for 2025? Downgraded to a sleepy 1.4%. Core inflation? Up to a toasty 3.1%. Unemployment? Yep, that’s creeping up too. But in true Fed fashion, they assure us that inflation will gently float back down to 2.1% by 2027—as if markets, wars, and tariffs will politely cooperate with their spreadsheet fantasies. So, to recap: lower growth, higher inflation, more unemployment... but hey, at least the PowerPoint looked optimistic.

The Fed’s latest dot plot still clings to its fairy tale of two rate cuts in 2025—same as March—proving once again that hope is a monetary policy strategy.

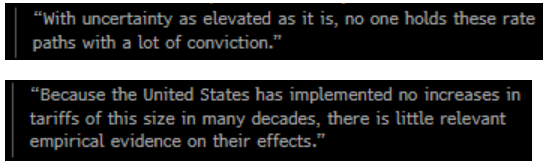
In his press conference, Powell expertly dodged every attempt to pin him down on future rate moves, essentially admitting that no one on the FOMC is betting the farm on their own forecasts. As for the Middle East conflict, he downplayed the impact, noting that since the U.S. no longer relies heavily on the region for oil, the market might just shrug it off—assuming, of course, that geopolitics starts taking Fed talking points seriously.
Adding yet another log to the bonfire of economic uncertainty, the Fed announced—almost cheerfully—that it will keep trimming its balance sheet by $5 billion a month. Because nothing screams “we’ve got this under control” quite like tiptoeing away from a $7 trillion mountain of IOUs with scissors and a prayer.
FED Balance Sheet (blue line); US Unemployment Rate (red line).

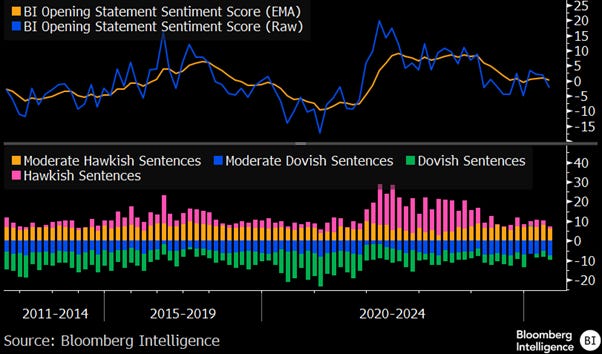
Powell’s opening remarks stuck safely to the middle lane, though Bloomberg’s Rate Strategy sentiment gauge picked up a slightly more dovish tilt than in May—fewer hawkish jabs, a bit more feather-soft talk, but still no clear off-ramp in sight.
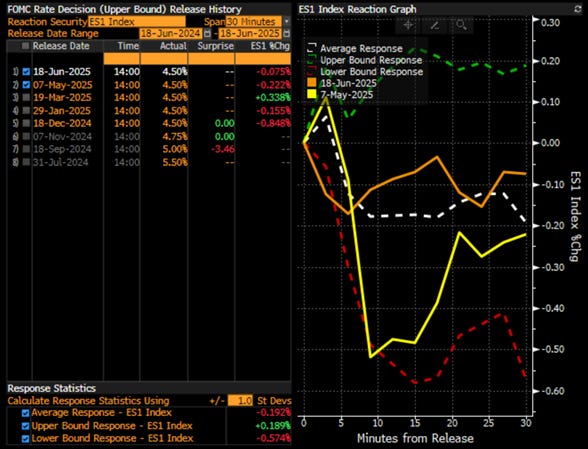
At the end of the day, the June meeting confirmed what many already suspected: the Fed is eyes wide shut, powerless to steer the economic ship, and likely to lose the looming battle against tariff-fueled stagflation. As for the market’s reaction? A touch more bullish than in May—because investors know the real driver of the business cycle isn’t Powell’s pressers, but good old-fashioned chaos.
Thoughts.
While Wall Street still clings to the fantasy that the FED can control business cycles, a look at the FED Funds rate and the S&P 500-to-oil ratio reveals a clear pattern: rate cuts often mark the peak of this ratio, and no rate cycle has ever stopped it from falling below its 7-year moving average, signaling the shift from boom to bust.
Upper Panel: FED Fund Rate (purple line); Lower Panel: S&P 500 to WTI ratio (green line); 7-Year Moving Average of the S&P 500 to Oil ratio (red line).

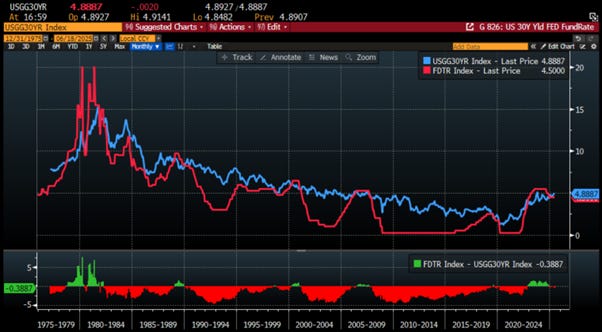
Investors will remember that despite Wall Street's belief the FED can only control the short term rate while long dated interest rates are set by the market and impact the life of every American consumers and businesses as they borrow to buy houses, cars and expand their business at a rate which is dependent of the US 10-Year and 30-Year yields. In no cases the action of the FED on the FED fund rates impacts the evolution of the long-dated yields.
US 30-Year Yield (blue line); US FED Fund Rate (red line) & Correlation.
Back in April when the ‘Tariff Tantrum’ was making headlines, as bond yields spiked and rumors swirled that China or Japan were dumping Treasuries and while the $2 trillion basis trade quietly imploded, the ‘Treasurer In Chief’ popped up on Bloomberg to play financial firefighter. He casually mentioned he grabs eggs and coffee with Powell weekly and might "up the buybacks" if the FED stayed asleep.

Fast forward to June: the Fed’s still on mute, yields are dancing near 5%, and voilà—Bessent drops a $10 billion buyback bombshell, the biggest in history. QE-lite? Buybacks for bonds? Call it whatever you like—just don’t call it price discovery.

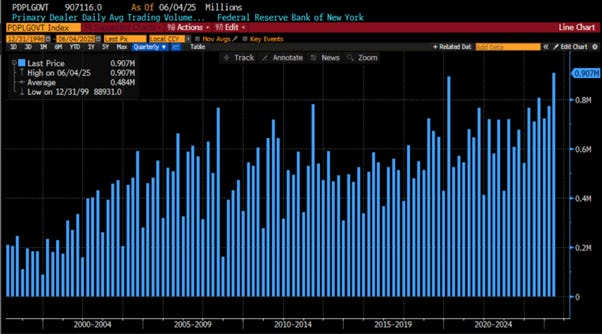
While the usual suspects—financially allergic journalists and YOLO-touting YouTubers—scream that the $10 billion Treasury buyback is a desperate ploy to save the dollar and stave off economic Armageddon, let’s take a breath. The U.S. Treasury market trades over $900 billion a day. A $10 billion buyback? That’s like a gnat trying to steer a battleship.
Primary Dealer Daily Average Trading Volume In US Government Securities (in million USD)
What’s truly laughable is the chorus of pundits calling the $10 billion Treasury buyback “QE Light”—as if the Treasury could magically print money. It can’t. The Treasury only issues debt: it doesn’t create money. Even actual QE isn’t “money printing” in the literal sense—it’s a duration swap where the FED buys long-term bonds to influence long-term rates, which are ultimately set by the market. The FED only controls short-term rates.
FED Balance Sheet (blue histogram); US 10-Year Yield (red line).

Yet every time, it’s the same tired chorus: "Sell dollars! The end is nigh!"—a song on repeat since Nixon ditched Bretton Woods in ’1971. Meanwhile, the U.S. Treasury market remains the deepest, most liquid on Earth, with everyone from foreign governments to pension funds swimming in it. So no, this wasn’t some ‘Bondpocalypse’ prevention maneuver—it was a routine effort to smooth the debt profile, targeting maturities between mid-2025 and mid-2027. The real kicker? As Powell’s higher-for-longer rates jack up borrowing costs, Treasury’s buybacks are just a quiet admission: Keynesian levers are broken, and the debt beast needs gentler feeding.
In 1995, President Clinton surprised many by balancing the U.S. budget—something that seemed almost magical at the time. But the real trick wasn’t fiscal wizardry; it was global capital flows doing the heavy lifting. After U.S. interest rates spiked in 1994, capital came flooding into America, especially from Japan. This surge was magnified as investors fled Southeast Asia, paving the way for the Asian Currency Crisis of 1997. In short, Clinton didn’t tame the deficit—he rode a tidal wave of foreign capital looking for safety and yield.
FED Fund Rate between 1990 and 2003.

In his April interview with Bloomberg, the ‘Treasurer In Chief’ brushed off fears that foreign central banks were driving a U.S. bond selloff, pointing instead to leveraged position unwinds. The Japanese yen’s April high didn’t even surpass its 2024 peak, and ironically, much of Japan’s U.S. debt holdings are by private institutions hedging against their own government's monetized debt. What the press missed entirely was Bessent’s hint that Treasury buybacks could expand if needed. Reporters asked if he was working with Powell to stabilize the bond market, prompting Bessent to wave off the panic—rightly so. This isn’t new. Clinton balanced the budget in the '90s not through fiscal magic, but by shortening debt maturities to cut interest costs. While the national debt still rose, the shift slowed its pace. Once short-term rates dropped post-Dot-Com bust, the strategy paid off—until rising rates later made it costly.
Meanwhile, mainstream analysts obsess over the Fed, often misunderstanding its role entirely. Conspiracy theories about big banks owning the Fed miss the point: Congress, not the FED, pulls the fiscal trigger. The Fed’s structure was designed to avoid taxpayer-funded bailouts. The real issue isn’t the Fed—it’s persistent deficit spending. History offers a lesson: when Andrew Jackson killed the Second Bank of the U.S., the result was the sovereign debt crisis of the 1840s and the “Hard Times.” The parallels are hard to ignore.
US Public Debt to GDP (histogram); US FED Fund Rate (blue line).

Read more and discover how to trade it here: https://themacrobutler.substack.com/p/eyes-wide-shut-fed
If this research has inspired you to invest in gold and silver, consider GoldSilver.com to buy your physical gold:
https://goldsilver.com/?aff=TMB

Disclaimer
The content provided in this newsletter is for general information purposes only. No information, materials, services, and other content provided in this post constitute solicitation, recommendation, endorsement or any financial, investment, or other advice.
Seek independent professional consultation in the form of legal, financial, and fiscal advice before making any investment decisions.
Always perform your own due diligence.