
From Paycheck to Pinch: The ‘Trumpflation’ Crunch Ahead
What’s behind the numbers?
The seventh CPI print of this grand Jubilee Year waltzed in with a dainty +0.2% MoM rise—right on cue, a smidge softer than June’s +0.3%. Year-on-year inflation drama? Still stuck at +2.7%, missing the +2.8% forecast by a hair and refusing to move from June’s number. Energy, ever the show-off, swooped in with its superhero cape (thank you, oil) to keep the “deflation” plot alive, while goods inflation staged a feisty comeback with its hottest YoY showing since June 2023. Meanwhile, food prices clung on like that one party guest who just won’t leave, and core services kept trudging higher at a steady 2.2% annualized pace—quietly, but with intent.
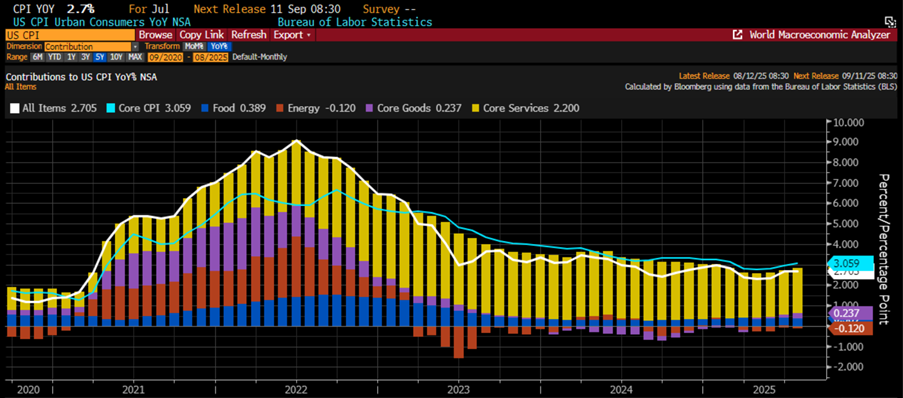
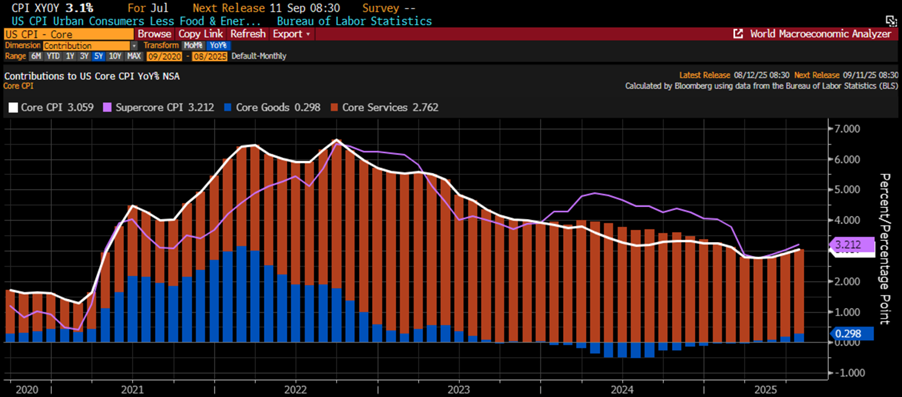
Core CPI in July strutted in at +0.3%—exactly as expected, but still a touch toastier than June’s +0.2%. Year-on-year, it nudged up to 3.1%, topping the 3.0% forecast and marking a clear reacceleration from June’s 2.9% and the fastest yearly pace since January. Core services—making up a hefty 76% of the index and basically the entrée at the inflation buffet—rose to 2.76% YoY, while core goods stayed inflationary for the fourth month running. And yes, this is month 62 of uninterrupted core CPI gains. But don’t worry—only economists, investors, central bankers, and anyone buying food are keeping track.
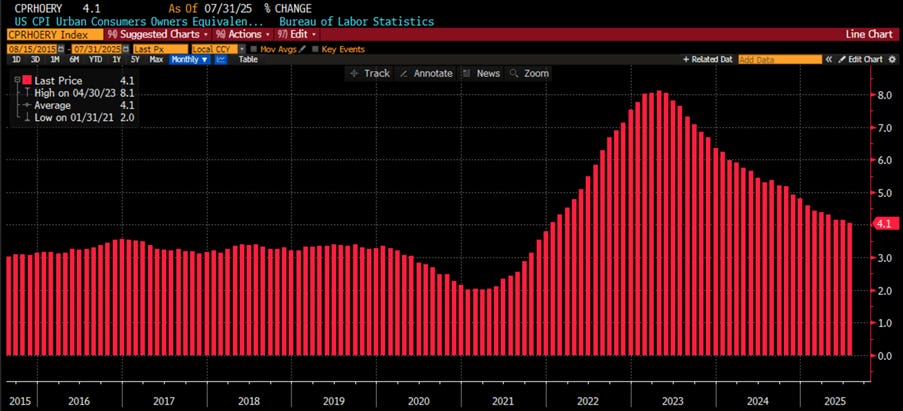
A favorite stat for the “inflation is over” cheer squad: Owners’ Equivalent Rent—the zombie of CPI—shuffled in at +4.1% YoY in July, a hair cooler than June’s +4.2% and its “chilliest” level since January 2022.
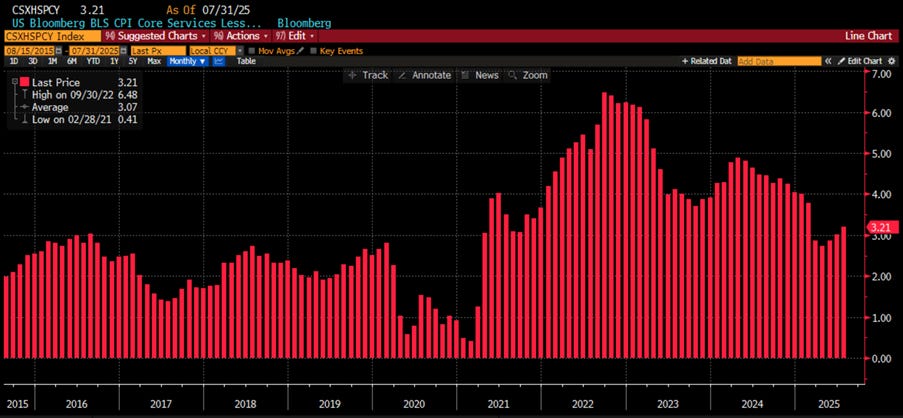
Even less soothing for the “inflation is dead” pep squad: SuperCore CPI—core services ex-housing, the Fed’s pet metric—sped up to 3.21% YoY in July from June’s 3.02%, marking its fourth straight month of reacceleration. So much for the victory lap—the only thing cooling off is common sense. So yes, inflation has totally vanquished… if you squint hard, forget about rent, food, and reality, and inhale a generous puff of ‘hopium’.
Thoughts.
July’s CPI confirmed what anyone buying groceries already knew: the deflation blip of the first quarter was a fluke, and the Trump Reflation train has left the station—tariff tax and all. While the “Manipulator in Chief” and his central bank sidekick toast their imaginary 2% victory, aggregate inflation still jogged around 3.0% YoY. But hey, nothing says “success” like reducing corporate margins and taxing consumers with a smile.
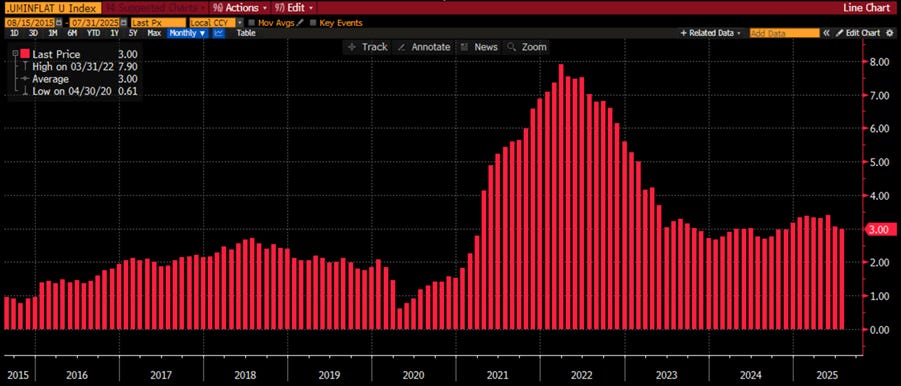
US Umbrella inflation Index (Average of CPI; Core CPI; PPI; Core PPI; Core PCE, 1-year consumer inflation expectations)
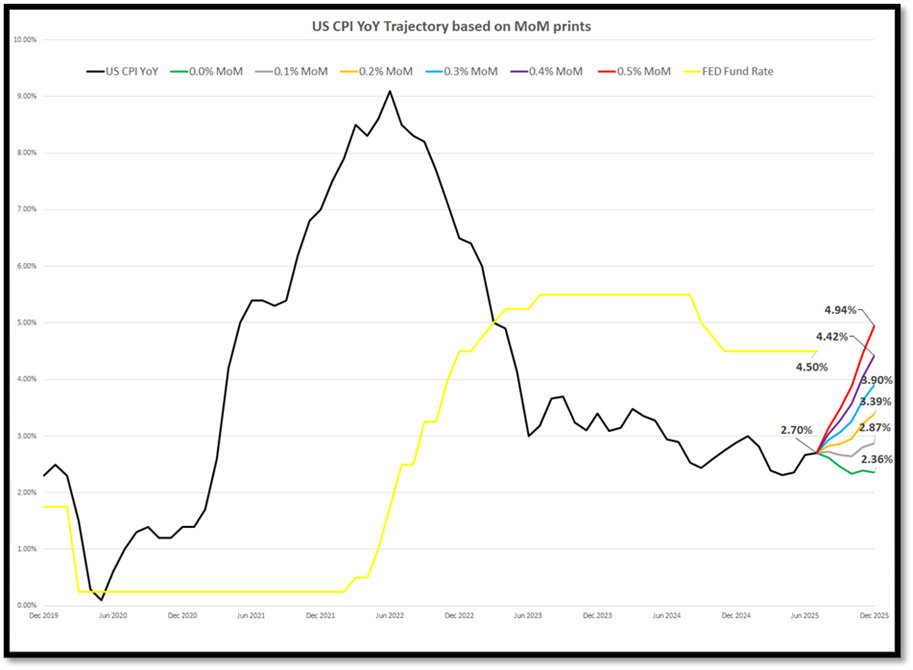
Instead of daydreaming about 2% inflation magically appearing before the Jubilee Year ends (cue harp music and sparkles), seasoned investors—unlike the espresso-addled PhD brigade at the Fed—can do the math.
For that fantasy to happen, CPI would need to moonwalk below 0% monthly—a pipe dream in a world “tarrified” and flirting with WW3.
If monthly prints hit 0.2% or more? We’re staring at 3.4%–5.0% CPI by year’s end.
And in that case, not even Donald Copperfield threatening to saw the “Central Banker in Chief” in half will keep the Fed from sheepishly admitting that cutting rates in the middle of an inflationary boom was not, perhaps, their finest hour. Autumn rate hike, anyone?
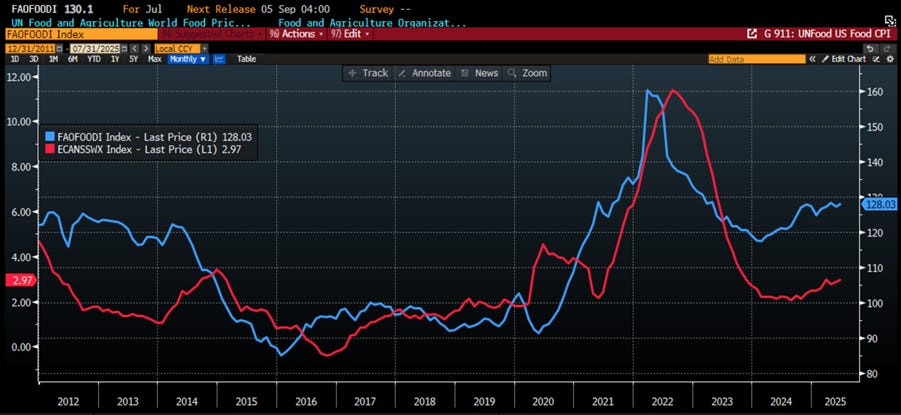
Anyone still clinging to the fantasy of “transitory inflation” might want to take a stroll down the grocery aisle. Despite the post-Covid and post-Ukraine war “recovery” narrative, global food prices are once again on the rise. According to the ever-reassuring FAO, their Food Price Index hit 130.1in July 2025 — up 7.6% from last year and 37% higher than in July 2019. But hey, at least it's not the March 2022 peak of 160, right? After a brief Covid discount (thank you, demand shock), prices rocketed in 2021 thanks to supply chain chaos and poor harvests. Then came the war, grain blockades, and the usual scramble for alternative shipping routes. Now, even with cereal and sugar prices dipping, the cost of dairy, meat, and oils is marching ever upward. But don’t worry — experts assure us this is all under control.
UN Food & Agriculture World Food Price Index
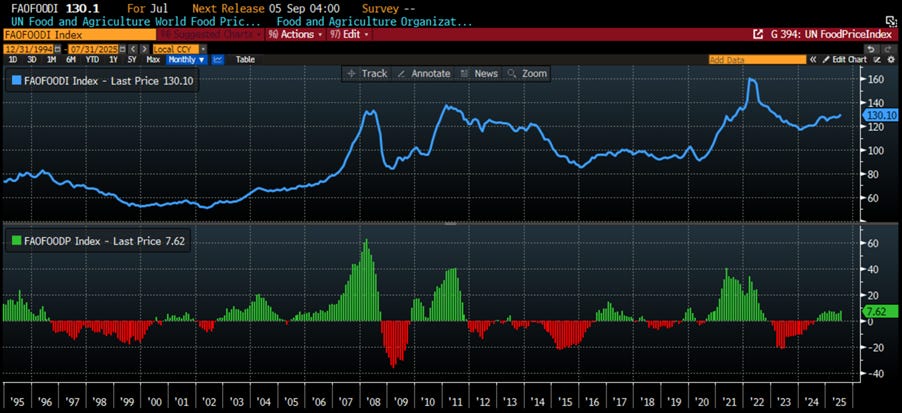
Global food prices in July 2025 managed a modest 1.6% rise—because apparently meat and vegetable oils decided to party while cereals, dairy, and sugar stayed home. Cereals slipped on plentiful wheat harvests, though stubborn farmers and dry weather kept maize from falling too far. Vegetable oils hit a three-year high as palm, soy, and sunflower oils flexed their market muscles, while rapeseed oil quietly sulked. Meat prices hit yet another record thanks to insatiable demand for beef and lamb, because nothing says global economic health like record steak prices. Dairy barely moved, with butter and milk powders sliding but cheese refusing to play along. Sugar prices fell for the fifth straight month, as forecasts for bigger harvests in India, Thailand, and Brazil promised a sweeter 2025—though not sweet enough to stop a little rebound in demand.
https://www.fao.org/worldfoodsituation/foodpricesindex/en/
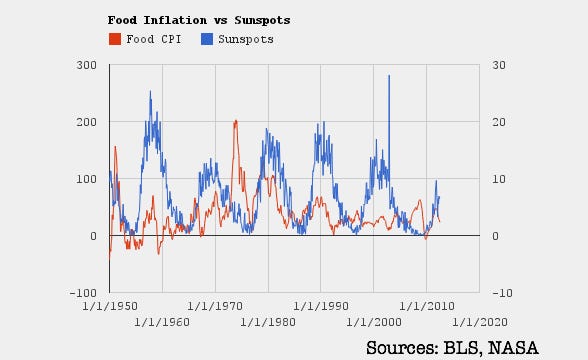
Most will roll their eyes, but if you're into cycles, you'll know the mother of all cycles is the solar cycle. When the sun chills out, so does everything else—literally. Less solar activity zaps the Earth's electric mojo, cools the planet, and weakens the glue that holds our cosmic Lego set together. Result? More quakes, more eruptions, and fewer sunny beach days.
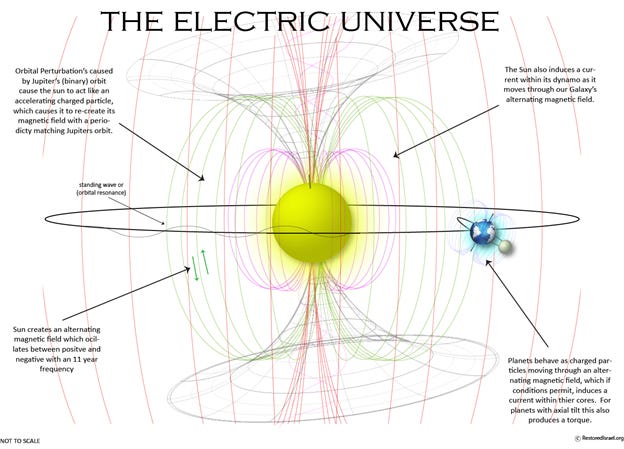
Most folks blame cow farts and SUVs, but the real cosmic puppet master is: The sun.
When solar activity dips, Earth’s electric vibes dim too. This isn’t just bad news for your tan—our planet slows its spin just a bit. That tiny slowdown makes the crust, which is basically a flimsy eggshell, start slipping over the heavier, grumpier mantle. Think tectonic exfoliation. And yes, the wandering magnetic pole might just be tracking this celestial slip-n-slide at 40 miles a year. Now, the whispers among solar nerds are growing louder: we may not just be in a regular Grand Solar Minimum (GSM), like the Dalton Minimum. We might be heading into a supercharged, boss-level version—let’s call it the Grand Grand Solar Minimum (GGSM).
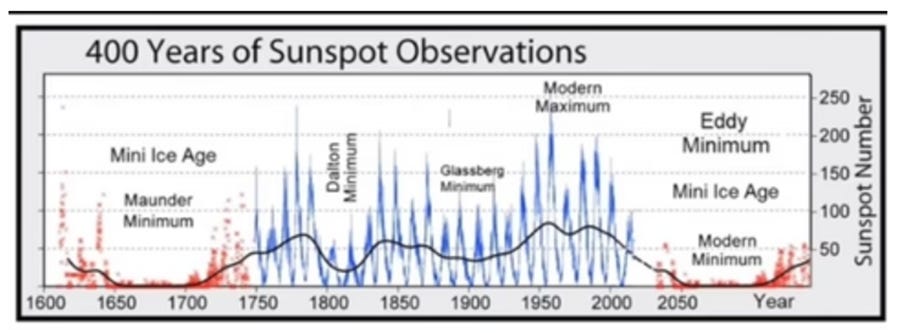
History has a nasty habit of repeating itself during these cold spells. The Dalton Minimum gave us the French Revolution, which conveniently followed a manipulated wheat shortage. Starving people, cosmic tension, political chaos—it’s a perfect recipe for guillotines and tyranny. And let’s not forget 536 AD—volcanoes blew their tops, filled the air with sulphur, and boom: years of global respiratory misery followed by the Plague of Justinian. A similar encore came during the Spörer Minimum with the Black Death. So yeah, the sun naps, Earth freaks out. The big question: if this is a once-in-400-year shakeup, what happens if it’s a once-in-2,000-year cosmic smackdown? Stock up on popcorn (and maybe iodine). The sky’s not falling—but it might be plotting.
While central bankers and politicians pat themselves on the back for "controlling inflation" with their godlike Keynesian wizardry, those of us living in reality know better. Sorry, but no amount of PhDs or press conferences can out-muscle the sun.
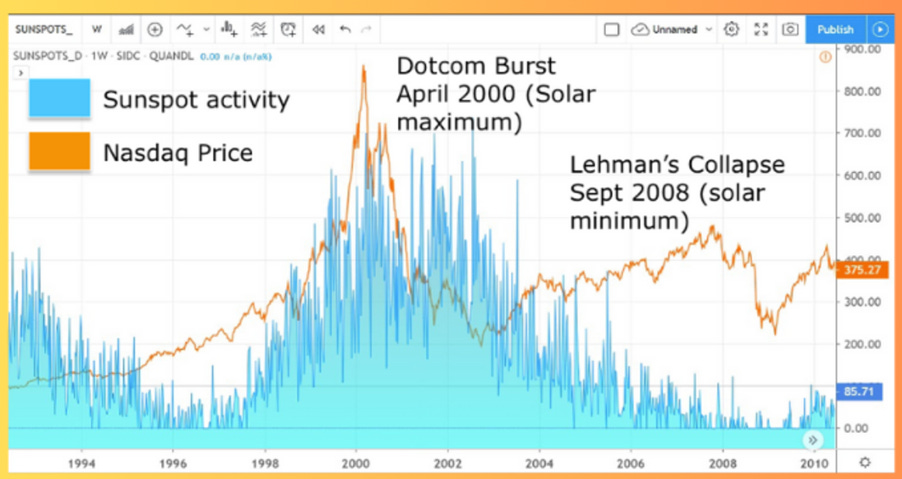
Food prices? They’re not dictated by some bureaucrat’s spreadsheet or a central banker’s PowerPoint — they’re driven by forces a little more powerful, like solar cycles. Yes, the sun — that big burning thing in the sky — seems to have more influence on markets than any policy ever dreamed up in Washington or Brussels. Every ~11 years, the solar cycle swings from quiet to chaotic. Fewer sunspots? Colder winters, crop failures, rising food prices. More sunspots? Boom-bust volatility. Irving Fisher, long before “transitory inflation” was a thing, connected sunspots to economic crashes. But sure, let’s keep pretending it's all about the Fed's rate hikes. Need a few examples? The 1929 crash? Solar maximum. Black Monday in '87? Solar minimum. Dot-com implosion? Maximum. Lehman collapse? Minimum. But yes, tell us again how central bankers are “managing” the economy. The sun doesn’t care about your macro models — and neither does the market.
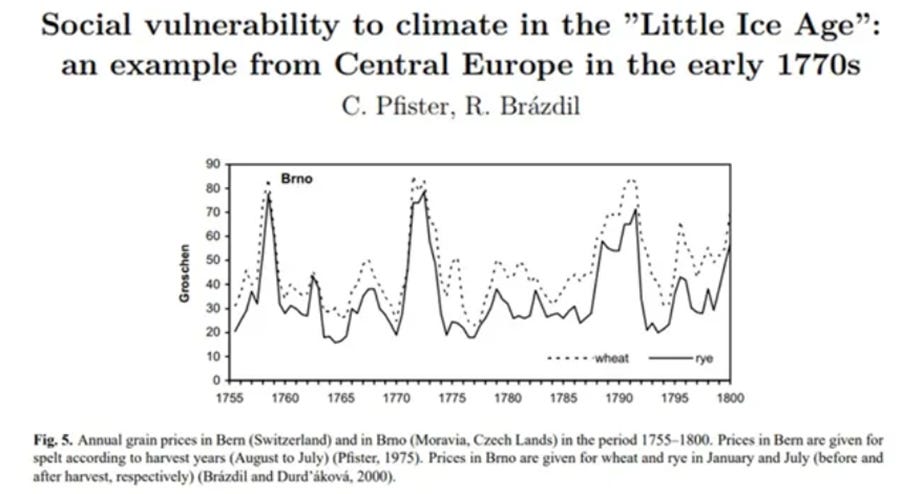
Long before central bankers declared themselves high priests of the economy, W.S. Jevons — and later his son H.S. Jevons — dared to suggest something far more heretical: that the sun, not suits and spreadsheets, drives economic cycles. Yes, sunspots. Enter the so-called “sunspot theory,” which links solar activity to agricultural output and, by extension, the entire economic machine. Sounds bizarre? Maybe. But not nearly as bizarre as thinking a rate hike will fix a drought.
Jevons didn’t just make it up — he brought data. Analysing English grain prices from as far back as 1259, he noticed a suspiciously consistent pattern: prices peak around the fourth year of an 11-year solar cycle, crash by the tenth, and recover by year one of the next cycle. Wheat, barley, oats, peas — all doing a little solar waltz.
Of course, Jevons didn’t ignore wars, tech changes, or irrational consumer behaviour. He just had the audacity to suggest that even those might be downstream effects of the weather — which is downstream of the sun. You know, actual causality. And here's the kicker: even today, with GPS tractors, gene-edited crops, and Wall Street algorithms, food prices still seem to dance to the rhythm of solar flares. But sure, keep believing inflation is all about "tight labour markets" and not a 5-billion-year-old nuclear furnace in the sky.
https://www.k-state.edu/economics/about/staff/websites/kuester/Sunspots.pdf
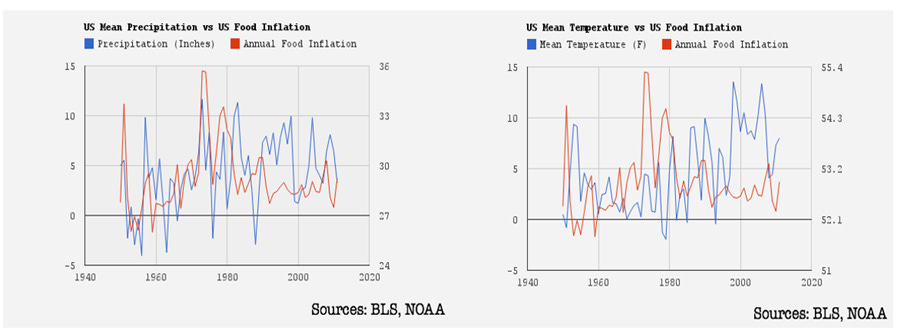
Some might naively assume it's just a simple drought story — less rain, fewer crops, higher prices. But surprise: too much rain can also ruin harvests. Nature doesn’t care about your linear thinking. In fact, the data shows the opposite of what most expect — more rain often leads to higher food inflation. As for temperature? The relationship there is fuzzier than a central banker’s inflation forecast.
One of the clearest ways the sun slaps your wallet? Food prices. When solar tantrums or volcanic burps mess with crops, commodity prices go vertical. Japan’s so-called “Rice Apocalypse” in early 2025 says it all — rice prices doubled, the government raided its reserves, and farmers were left cursing the sky.
And it’s not just your grocery bill that feels it. Rising food costs stoke broader inflation. When food gets expensive, consumers tighten up, businesses get squeezed, and the economic engine coughs. But don’t worry, central banks have it totally under control… with their spreadsheets.
UN Food & Agriculture World Food Price Index (blue line); USD CPI Food YoY change (red line).
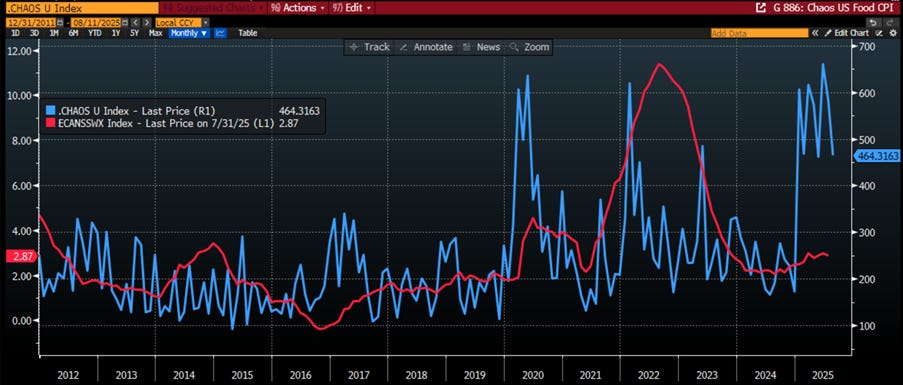
Sure, the solar cycle messes with food prices — but let’s not ignore the manmade chaos. Malthusian governments, hell-bent on control, keep stoking policy and geopolitical fires. And now that the ‘Disruptor-in-Chief’ is back in the Oval Office, the last six months have been anything but boring. So, no shocker here: U.S. Food CPI and the “Chaos Index” — a lovely mix of policy blunders and global tensions — are moving in lockstep. Translation? More chaos ahead means higher prices and emptier stomachs. Get ready to pay more for less — with a side of political theatre.
Chaos Index (US Economic Policy Uncertainty Index + Caldara Iacoviello Geopolitical Risk (GPR) Uncertainty Daily ) (blue line); US Food CPI YoY Change (red line).
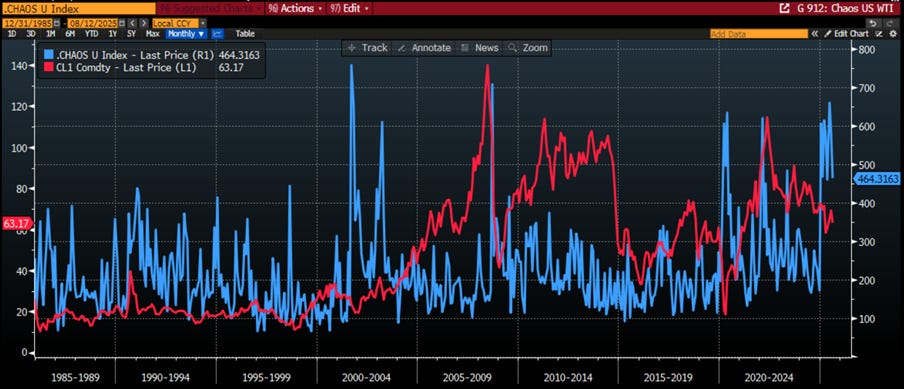
Outside of food, energy prices are another major culprit behind stubborn inflation — and surprise, they also tend to spike when chaos levels rise. Historically, there’s a cozy correlation between oil prices and whoever’s busy setting the world on fire from the White House. The more geopolitical drama they stir up, the higher the fuel bill. Coincidence? Please.
Chaos Index (US Economic Policy Uncertainty Index + Caldara Iacoviello Geopolitical Risk (GPR) Uncertainty Daily ) (blue line); WTI Price (red line).
As prices keep climbing and tariffs get tossed around like hot potatoes — guess what? Someone’s footing the bill. Whether it's producers or consumers, the real question is: how are wages holding up in this sticky inflation mess?
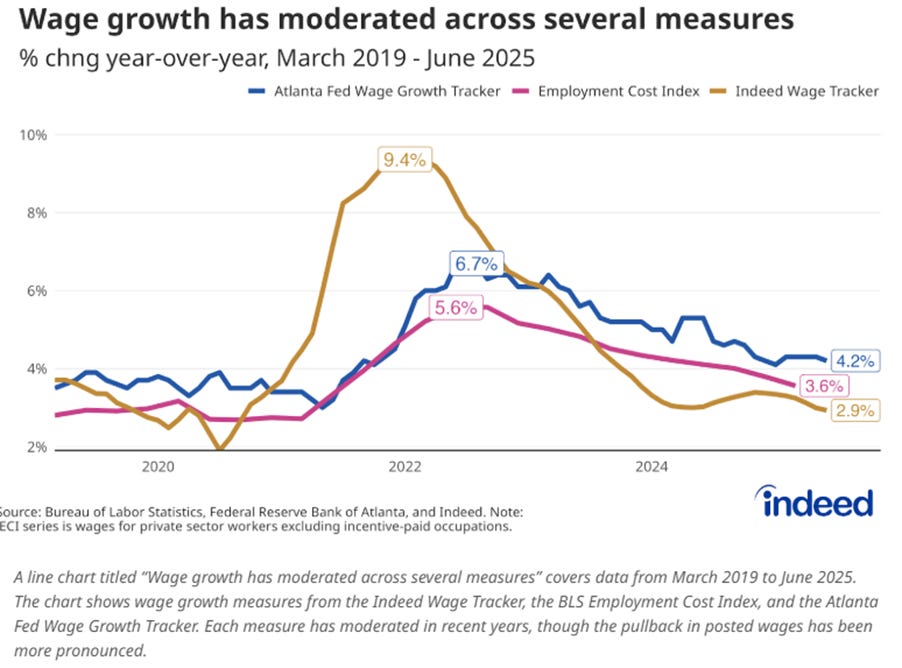
https://www.hiringlab.org/2025/07/24/july-labor-market-update-wage-growth-outpacing-inflation/
Despite what Donald Copperfield claims about the “booming” economy, his magic trick hasn’t reached workers’ bank accounts. According to the Atlanta Fed, 40% of Americans now earn less than what it takes to actually live — adjusted for inflation, of course. So much for prosperity.
Sure, 57% of workers got raises that beat inflation, but the other 43% are watching their lifestyles slowly deflate. Real wage growth? A whopping 0.7%. That’s an extra $9 a week — just enough to buy... a sandwich. Maybe. Even the job ad tracker from Indeed, which once showed sizzling wage growth, is cooling fast. The post-pandemic wage spike peaked in late 2021, and since then, it’s been mostly downhill. Hiring is slowing, inflation’s sticky, and wage growth is barely keeping up — but hey, the headlines still sound great, right?
Read more and discover how to trade it here: https://themacrobutler.substack.com/p/from-paycheck-to-pinch-the-trumpflation
Join The Macro Butler on Telegram here : https://t.me/TheMacroButlerSubstack
You can contact The Macro Butler at info@themacrobutler.com
If this research has inspired you to invest in gold and silver, consider GoldSilver.com to buy your physical gold:
https://goldsilver.com/?aff=TMB

Disclaimer
The content provided in this newsletter is for general information purposes only. No information, materials, services, and other content provided in this post constitute solicitation, recommendation, endorsement or any financial, investment, or other advice.
Seek independent professional consultation in the form of legal, financial, and fiscal advice before making any investment decisions.
Always perform your own due diligence.