
Jefferies Puts Gold at $6,600, M2 Says $12,000
Contents
- The Jefferies/Wood Gold Target
- Comment on the $6,600 Price
- What Does M2 Predict?
- Stagflation = $11,900
1- The Jefferies/Wood Gold Target
Authored by GoldFix ZH Edit
In a note to clients on September 18th titled India deepening and gold targets (h/t ZH), Chris Wood of Jefferies updated investors on the firm’s dollar model as it relates to Gold price. We break that down and then some. The gold bullion price has touched the US$3,700 per ounce level this week, surpassing the initial target that GREED & fear first published in December 2002. The bank therefore revisits the history of long-term price targets for the metal and the methodology underlying them.
In a note put out by Société Générale’s Chris Wood, the GREED & fear framework is reviewed to show how successive updates to income-based calculations have shaped long-term gold price targets. While the speed of rise is not discussed, we feel it is a credible target based on their simple methodology and suggest it as a candle for illuminating the darkness assuming no geopolitical catastrophe evolves.
Simply stated, at what % of total disposable income did Gold top in 1980? That is the basis for a peak target this cycle. We first break down his rationale and comment on the methodology. Finally we do a similar comparison using M2 for a proper comparison.
Evolution of Price Targets
The initial target of US$3,400 per ounce was set in December 2002. It was derived by adjusting the 1980 peak gold price of US$850 by the 6.3 percent annualized growth in U.S. total personal income that had occurred since January 1980. This calculation produced a level of US$3,437.
“The target was subsequently raised to US$3,700 per ounce at the beginning of January 2005 as a consequence of updating the growth in personal income.”
In September 2007 the methodology shifted. Rather than using aggregate personal income, the focus moved to disposable personal income per capita. Updates to this measure have driven subsequent revisions: to US$4,200 in March 2016 and to US$5,500 in August 2020.
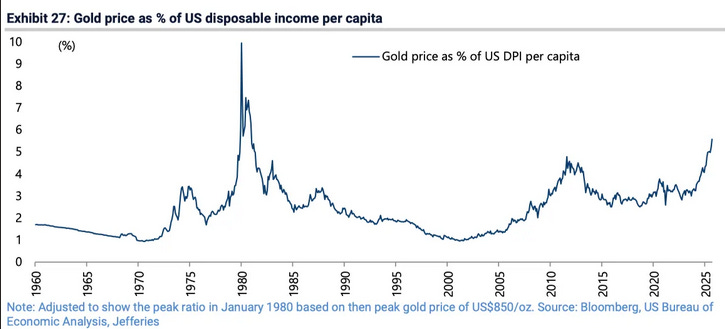
Disposable Income Ratio as Benchmark
“To reach 9.9 percent of disposable income per capita means gold should rise to US$6,571.”
At the peak of the last secular bull market in January 1980, gold reached US$850. That level equated to 9.9 percent of U.S. disposable income per capita, which stood at US$8,551. The current gold price of US$3,670 equates to 5.6 percent of disposable income per capita, now at US$66,100.
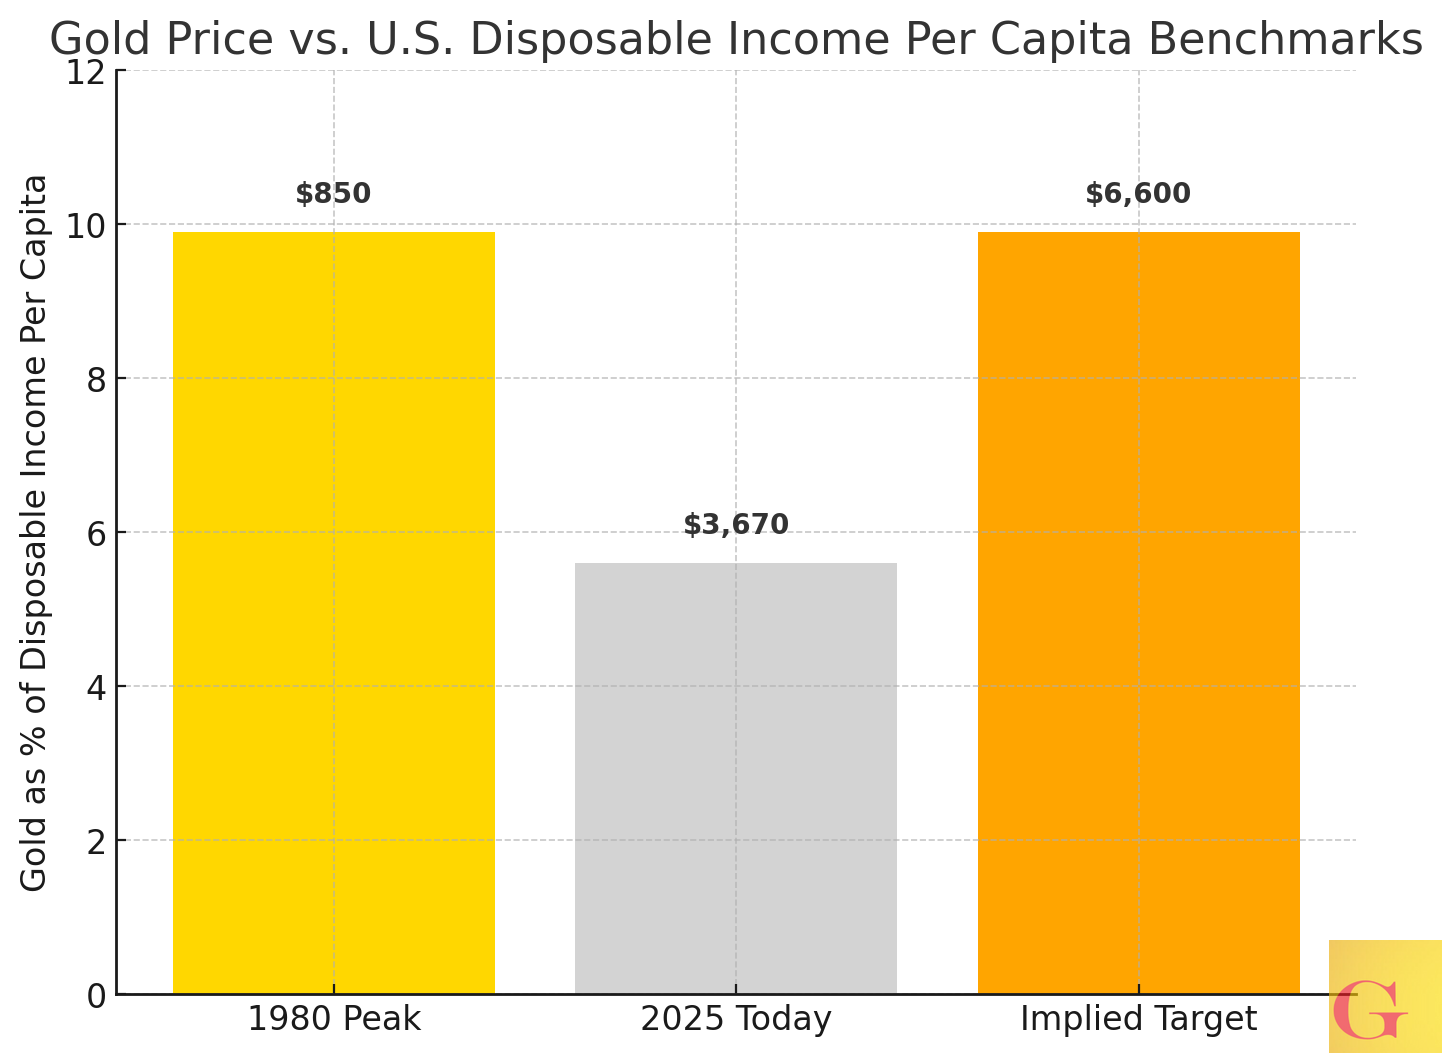
On this basis, the report proposes US$6,600 per ounce as a reasonable target for the peak of the current secular bull market.
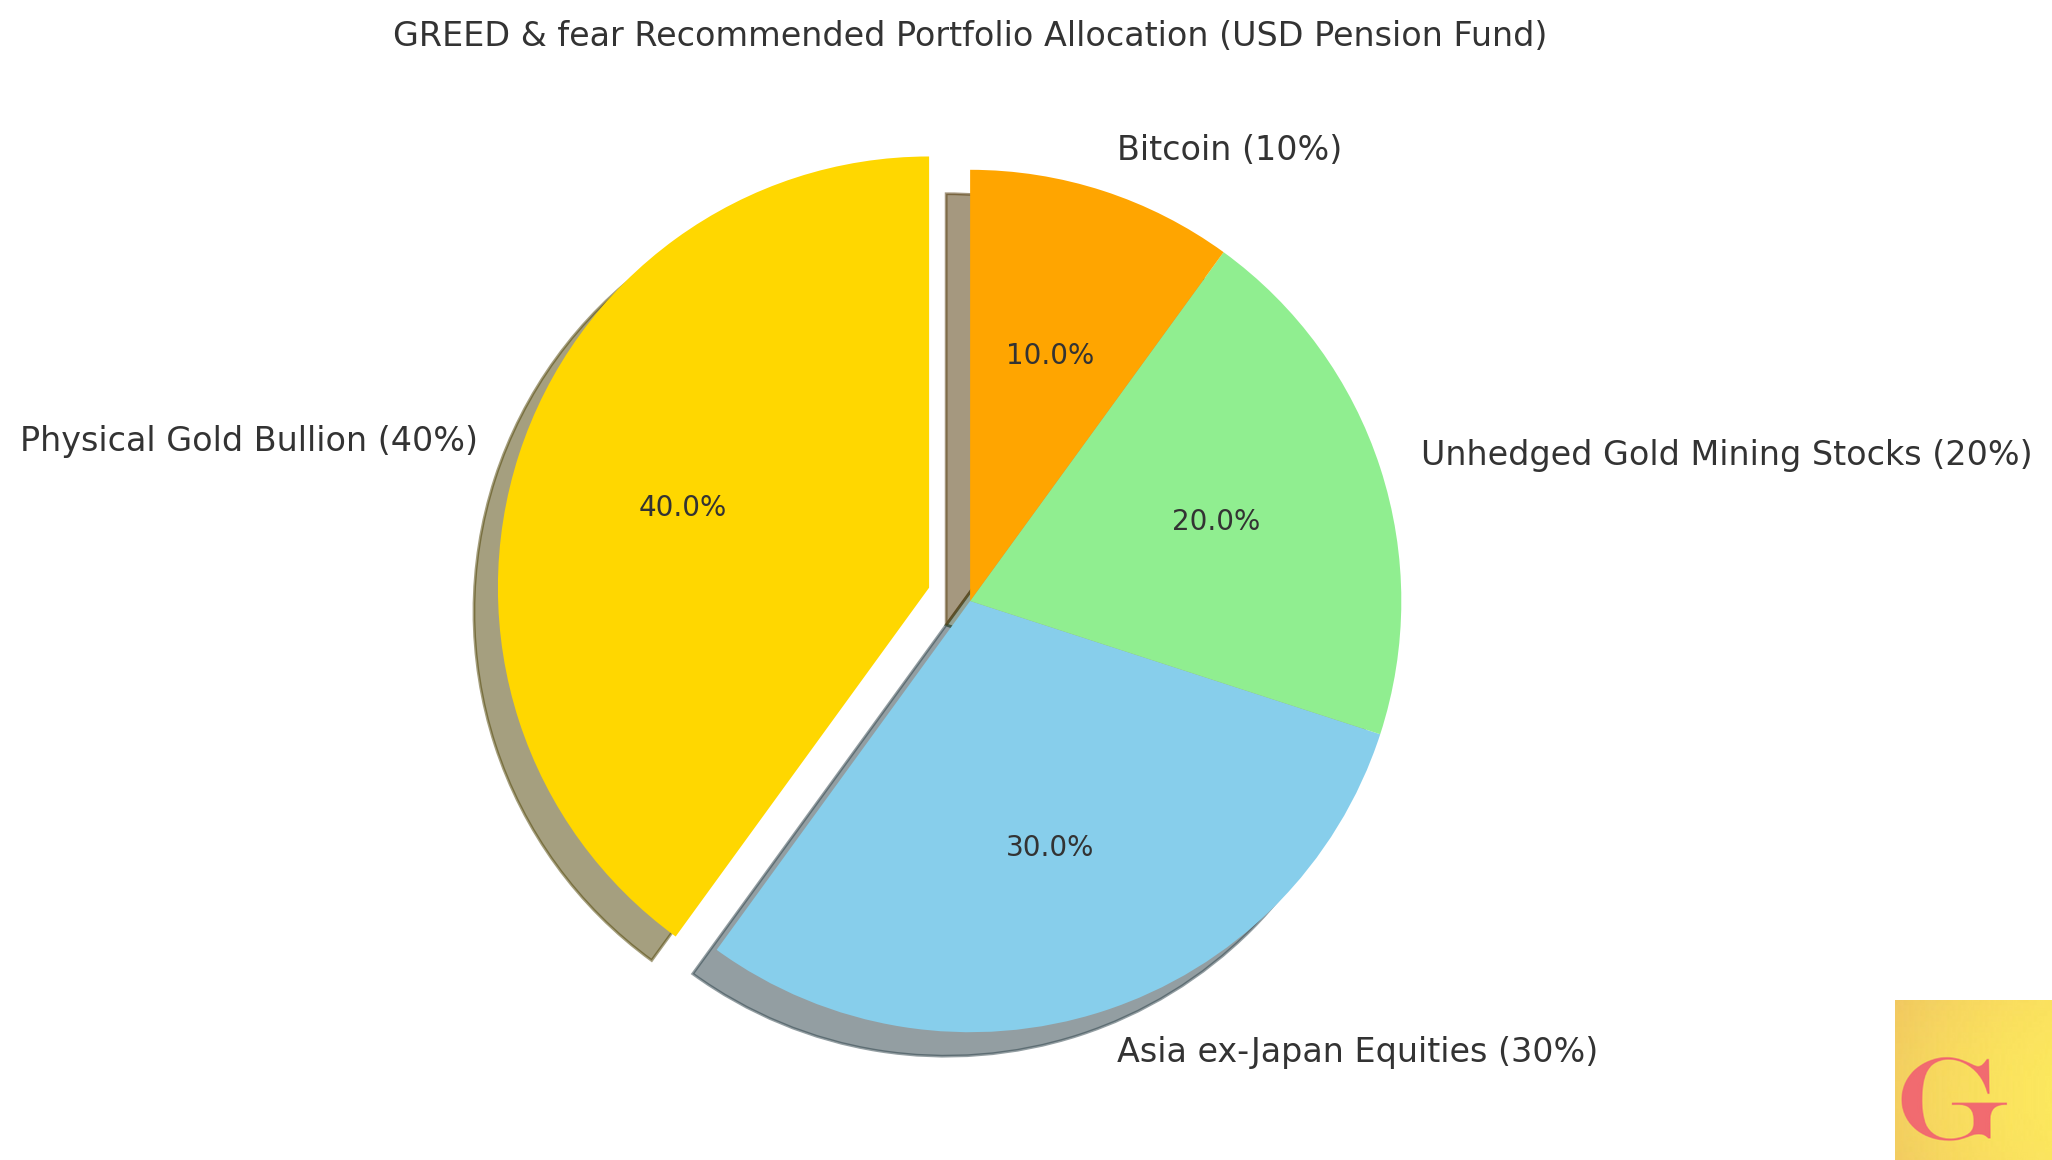
Portfolio Allocation Strategy
GREED & fear continues to recommend a 40 percent weighting to gold bullion within a global pension fund portfolio denominated in U.S. dollars. This allocation was set at the end of the third quarter of 2002 and has remained the minimum since.
“Gold was reduced from 50 percent in December 2020 when GREED & fear first allocated an investment in Bitcoin.”
2- Comment on the $6,600 Target
Chris Wood’s GREED & fear framework has consistently presented gold “targets” derived from income-adjusted calculations, yet closer inspection shows these figures align more closely with secular peak projections than with conventional price targets. Meaning: at what price is the absolute top if Gold does run?
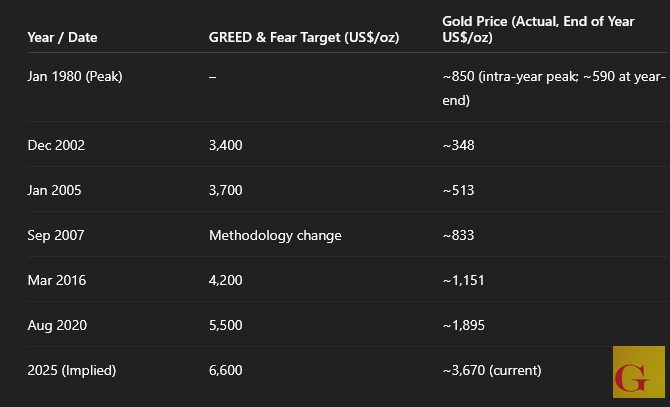
The methodology begins with the 1980 gold peak of US$850, which equated to 9.9 percent of U.S. disposable income per capita at the time. Subsequent revisions have simply updated the income denominator and reapplied the 9.9 percent ratio. This produced successive figures of US$3,400 in 2002, US$3,700 in 2005, US$4,200 in 2016, US$5,500 in 2020, and now US$6,600 as the implied level for the current cycle.
“At the peak of the last secular bull market in gold in January 1980, the gold price was then equivalent to 9.9 percent of US disposable income per capita.”
By design, these levels do not function as dynamic forecasts or tradable targets. They are benchmarks for potential secular highs, representing where gold might trade if it were to regain the same relative weight against household income as it did in 1980. This framing explains why spot prices have often lagged far below the published levels: the methodology does not seek to capture interim market dynamics, only the long-term destination at the height of a cycle.
Thus, while GREED & fear presents these numbers as “targets,” they are more accurately understood as implied peak valuations within a secular bull market framework, not forecasts of average levels or short-term outcomes. That’s not to say gold cannot trade even higher than their target if the secular changes engulfing the world get out of hand or if much of the world resumes a Gold standard in a reset scenario.
Now lets look at it from an M-2 Supply analysis side by side with Chris Wood’s for effect.
Jefferies Puts Gold at $6,600, But M2 Points to Nearly $12,000. pic.twitter.com/I3JcA3ks5T
— VBL’s Ghost (@Sorenthek) September 22, 2025
3- What Does M2 Predict?
“Applying the same logic to M2, the 14-fold increase in money supply from 1980 to today implies a gold price above US$11,900 per ounce.”
Continues here