
Fed & Furious: Breaking The Economy, One Rate Cut at a Time
What’s behind the numbers?
The Fed hit the nitrous once again — dropping rates from 4.25% to 4.00% — but don’t get too excited, this wasn’t a full drift. The vote came in at 10-2, proving even inside the Fed garage, there are a couple of drivers who still think they know a better line through the curve. Stephen Miran wanted to floor it with a 50 bps cut — pure Dom Toretto energy — while Jeffrey Schmid slammed the brakes, yelling “NO CUTS!” like he’s still stuck in traffic on the yield curve.
The Fed’s read on the economy? “Job gains have slowed, unemployment ticked up, but still low.” Translation: the engine’s misfiring, but Powell’s pretending it’s just the check-engine light. And when they say “downside risks to employment have risen,” that’s Fed-speak for: the tires are bald, the tank’s low, but we’re still racing full speed into 2025.
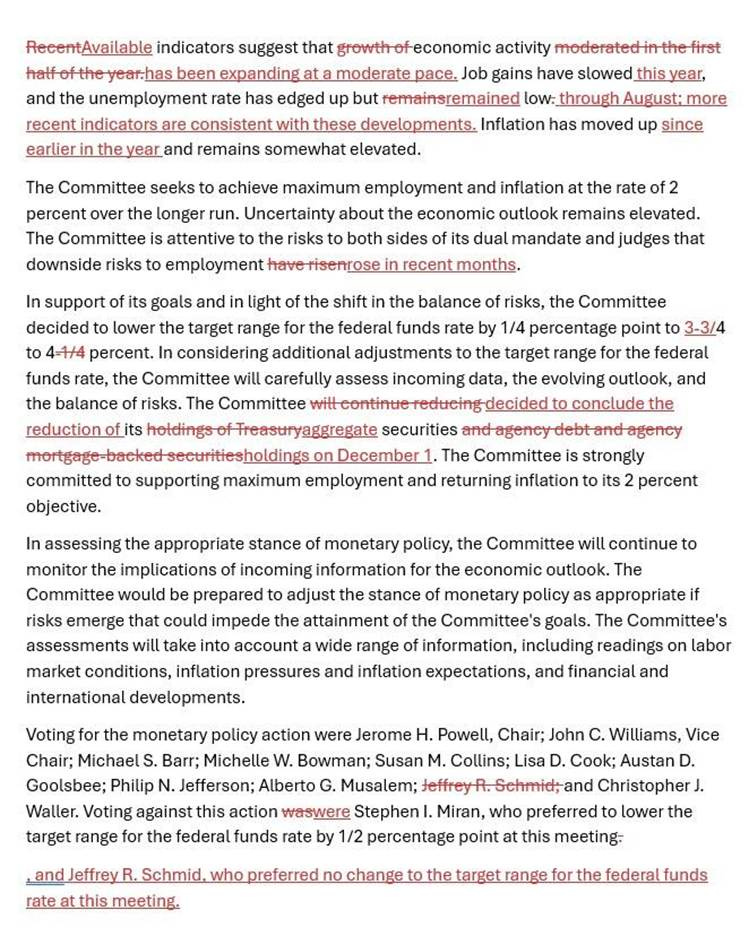
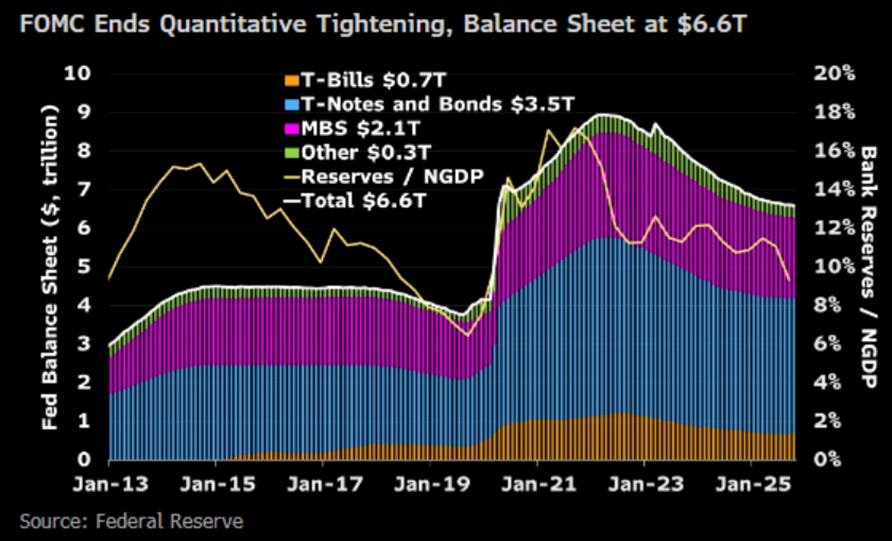
In a pure ‘Powell drift’, the FED dropped the end of its QT script. Starting October 30, 2025, the Fed’s rolling back QT and cruising into neutral: funds rate locked between 3.75–4%, repo pit stops capped at $500B, and reverse repo rides limited to $160B per day. They’ll still dump $5B a month in Treasuries until December, then—bam! —full reinvest mode, swapping MBS for short-term T-bills like Dom swapping muscle cars for nitrous tanks.
Translation: QT’s out, liquidity’s back, and Powell just hit the liquidity boost button before the next crash scene.
The “Central Banker in Chief” ‘s press conference felt straight out of Fast & Furious: Monetary Drift. He said bank reserves have gone from “abundant” to merely “ample,” hinting the Fed still has fuel but is no longer running on full. He made it clear: no guarantees, just a “let’s pause here” vibe. The labour market? “Kind of stable.” Spending? Still solid, though low-income consumers are sputtering. Inflation? Still making people honk. Powell’s message was simple: the Fed’s easing off the throttle to avoid blowing the engine before inflation heats up once again.
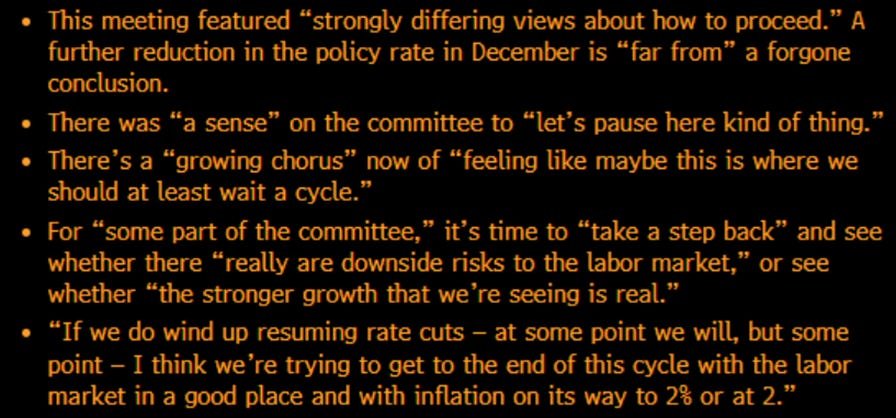
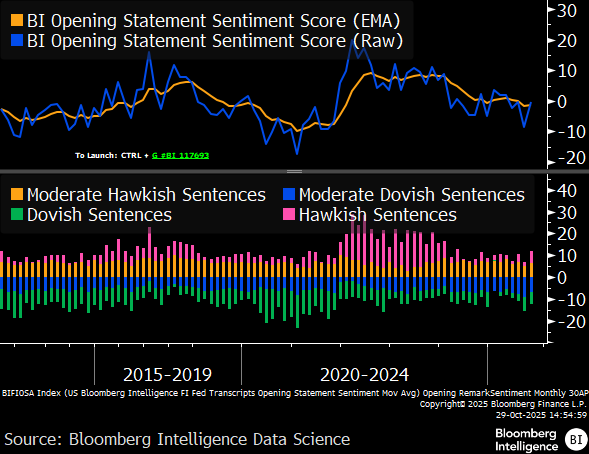
Powell’s opening remarks came in hotter than last month — more hawk, less dove. After bowing to political pressure from Donald Copperfield to restart rate cuts, the Fed chief returned with tougher talk and a clear message: the magic show is over, and this time, politics won’t drive the policy wheel.
Thoughts.
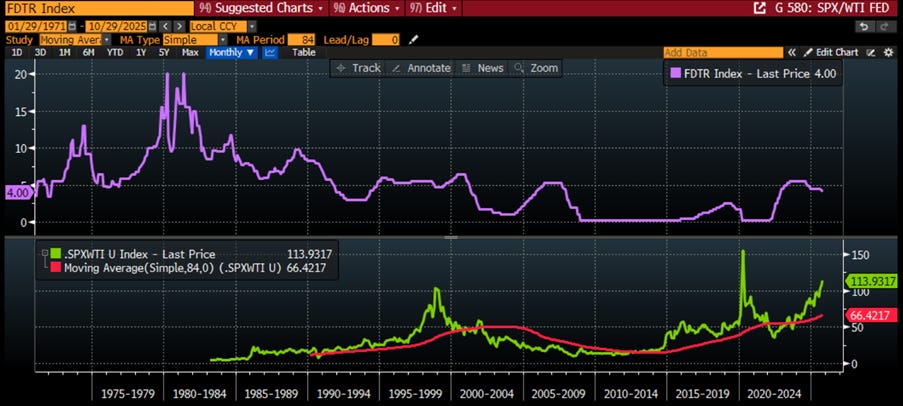
While Wall Street and Donald Copperfield keep performing their favorite magic trick—making investors believe that Fed rate cuts are somehow “good news”—the cold, unenchanted data tell a different story. Every time the Fed waves its wand and declares the cutting season open, it’s less “abracadabra” and more “brace for impact.” The S&P 500-to-oil ratio balloons like an overfed pigeon before plummeting through its 7-year moving average faster than a kamikaze seagull. In truth, every rate cut is the Fed’s polite way of ringing the dinner bell for the next economic bust.
Upper Panel: FED Fund Rate (purple line); Lower Panel: S&P 500 to WTI ratio (green line); 7-Year Moving Average of the S&P 500 to Oil ratio (red line).
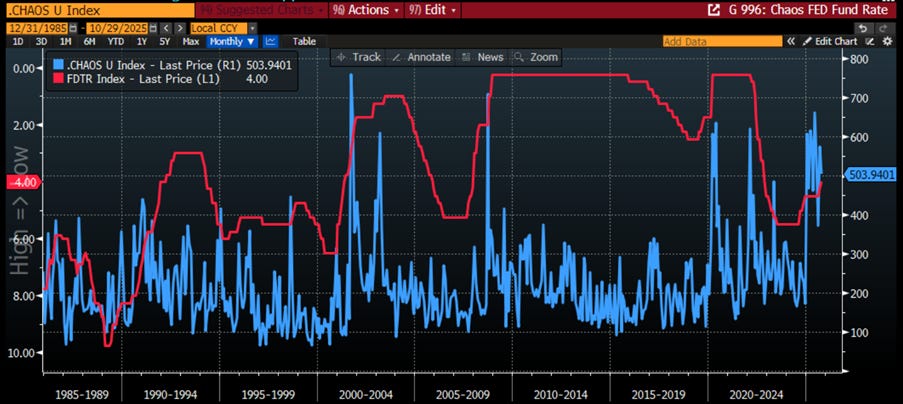
Investors should remember that the Fed has never managed to outsmart the business cycle—no one can. Yet every time the Fed grabs the scissors and starts cutting rates, there’s a chorus of believers convinced it’s all part of some brilliant preventive plan. In reality, it’s more like firefighters showing up after the house is already in flames. By the time rate cuts begin, chaos is no longer looming—it’s already unpacked its bags. Historically, Fed Funds rates are not cut to prevent turmoil; they bottom right when the chaos reaches its crescendo.
US Chaos Index (blue line); FED Fund Rate (axis inverted; red line).
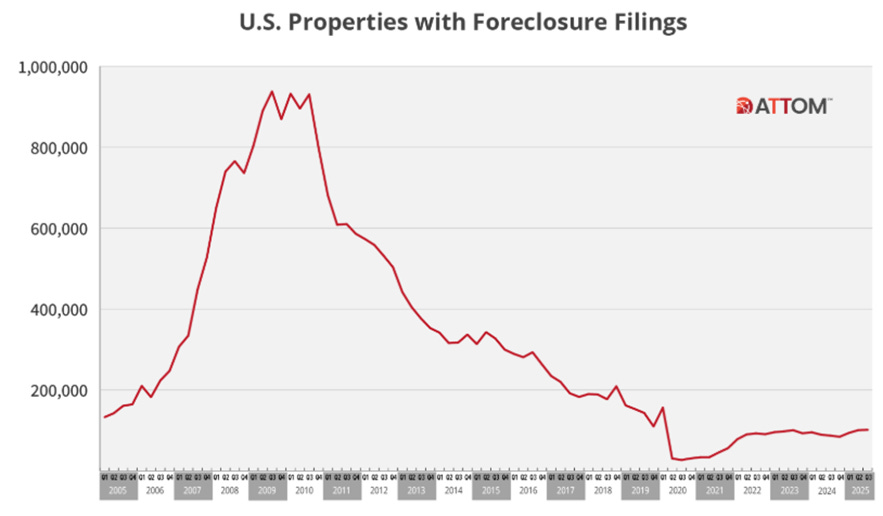
While Wall Street’s hypnotists and their pet “experts” on TV keep chanting that the U.S. economy is thriving, reality just filed for foreclosure. In Q3 alone, foreclosure filings jumped 17% year-on-year to over 101,000 properties — one in every 1,402 homes nationwide. Florida leads the misery parade with one in every 814 homes hit, followed closely by Nevada, South Carolina, Illinois, and Delaware. Among cities, Lakeland, Columbia, Cape Coral, Cleveland, and Ocala are taking the crown — proving once again that the so-called “booming economy” is mostly a bedtime story for gullible investors.
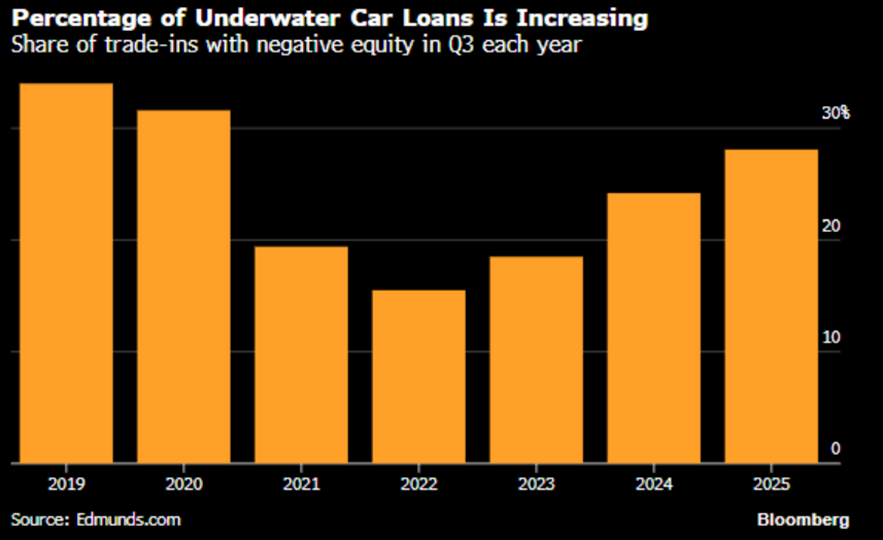
It’s not just homes getting repossessed—now the wheels are coming off too. Auto loan delinquencies over 60 days past due have surged 51.5% since 2010, outpacing credit cards and mortgages. With the average new car now topping $50,000, monthly payments averaging $767, and interest rates above 9%, even prime borrowers are falling behind. Americans are stretching loans to seven years or more, leaving many “upside-down,” owing more than their cars are worth. With automakers phasing out affordable models and consumers still chasing trucks and SUVs like status symbols, the so-called “American Dream” is looking a lot like an auto loan nightmare—on four very re-possessable wheels.
Adding another crack to the illusion of a “resilient” U.S. consumer, bankruptcies are quietly making a comeback. According to the American Bankruptcy Institute, 249,152 individual Chapter 7 filings were recorded in the first nine months of 2025 — a 15% jump from last year. Total bankruptcies hit 423,053, up 10% year-on-year, with individual filings rising 11% and Chapter 13 filings up 4%. Even small business bankruptcies climbed 6%, while only commercial Chapter 11s managed a modest decline. In September alone, total filings surged 16% from a year earlier, confirming that financial distress is spreading faster than any “soft landing” narrative. As household debt piles up and credit tightens, more Americans are seeking refuge in bankruptcy court — a grim sign that the so-called “strong consumer” may soon be as mythical as a balanced federal budget.
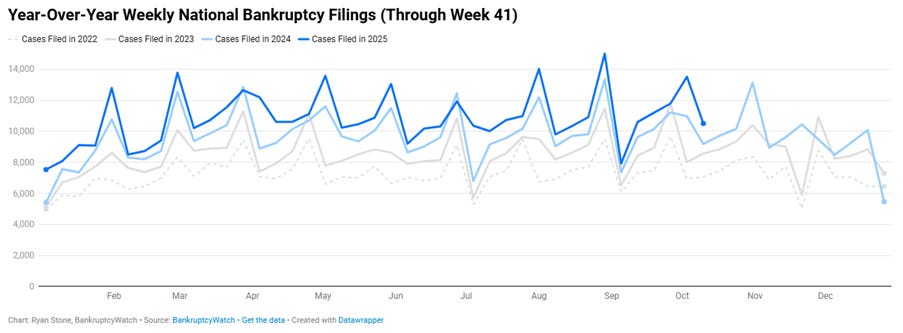
https://www.bankruptcywatch.com/statistics/2025-week-41-bankruptcy-report
While the Fed and its Washington pals float in their AI-generated ivory towers, reality looks far less digital. According to Bankrate, only 46% of Americans can cover three months of expenses, 30% have some savings but not enough, and 24% have none at all—because apparently, “emergency fund” now means “maxed-out credit card.” Gen Z, weighed down by avocado toast and student loans, is leading the charge into financial fragility. Sixty percent of Americans admit they’re uncomfortable with their savings, and one in three has already dipped into them—mostly just to survive. With wages stagnant, prices soaring, and “cheap debt” now biting back, this isn’t poor planning; it’s policy-induced poverty. The Fed’s illusion of prosperity is fading fast, and when the bill finally comes due, it won’t just be the banks paying—it’ll be everyone holding up this crumbling hologram of an economy.
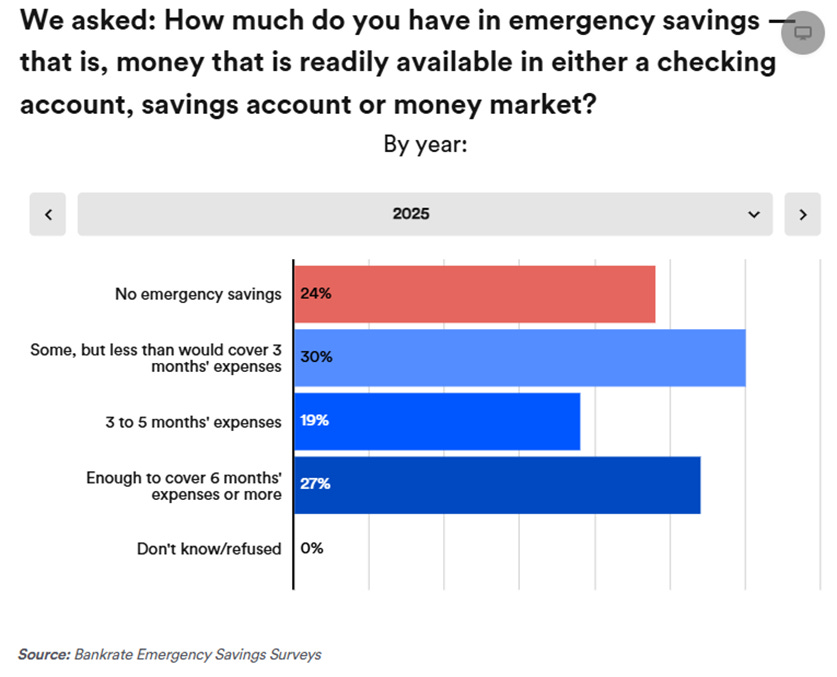
https://www.bankrate.com/banking/savings/emergency-savings-report/#no-emergency-savings
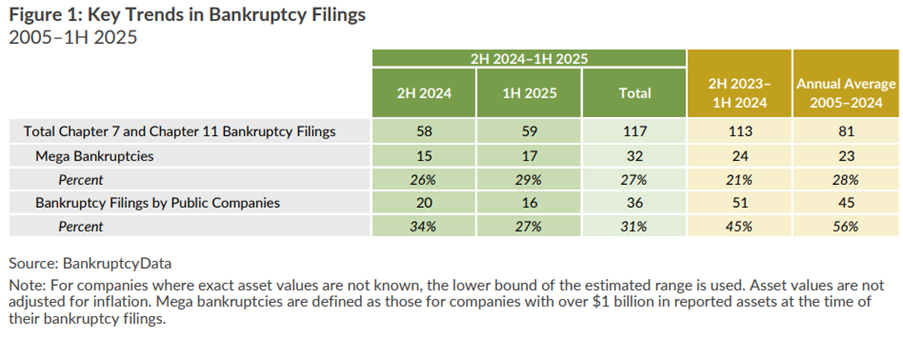
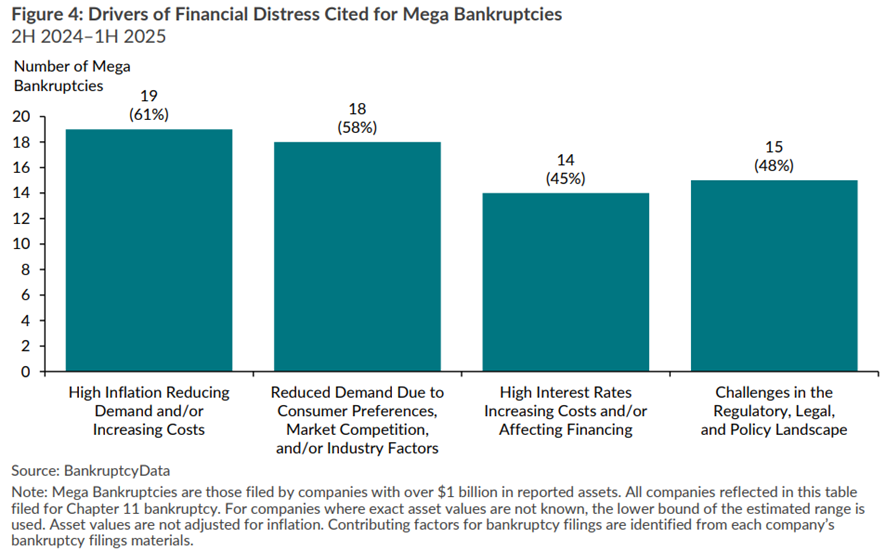
It’s not just consumers feeling the economic hangover — corporate giants are dropping like flies too. A record 117 firms with over $100 million in assets have gone bankrupt in the past year, a solid 44% above the 20-year average. Even the so-called “too big to fail” crowd is joining the party: 32 billion-dollar bankruptcies in the past year, the highest since the pandemic. Apparently, size no longer guarantees survival — just a bigger crater on impact.
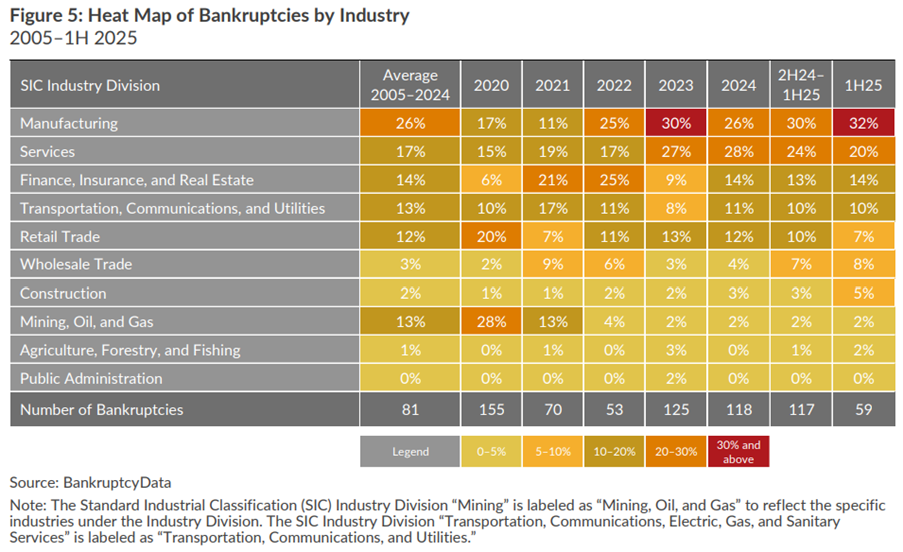
Manufacturing isn’t collapsing because of tariffs or worker shortages — it’s drowning in red tape. Two-thirds of major bankruptcies blame the regulatory, legal, and political chaos, while 61% cite collapsing demand as inflation squeezes consumers dry. The service sector, once the economy’s safety net, is now the hardest hit — because you can’t sell lattes to people who can barely afford lunch.
Every glossy report blames inflation on “external factors,” as if fiscal deficits and central bank meddling were acts of God. In reality, endless spending and rate tinkering have only worsened the rot. Mega corporations don’t collapse overnight — they erode over years of mismanagement, shifting regulations, ESG toxic policies, and tax creep. Liability management deals hit record highs, a desperate attempt to kick the can down a rapidly disintegrating road. Once rescued by bailouts, these giants now face a government too broke to play saviour. The surge in mega bankruptcies is the canary in the coal mine — proof that even the “too big to fail” are finally out of lifelines.
In other words, the U.S. regional banking sector is once again auditioning for a remake of the Subprime Crisis, with Zions Bancorporation leading the drama. On October 16, ZION booked a $50 million charge-off from two investment funds unrelated to First Brands or Tricolor—proving, as even Jamie Dimon warned, that there’s “more than one cockroach” in the system. Meanwhile, Western Alliance (WAL) is scrambling over a separate $100 million lawsuit against the same borrowers, signaling that anxiety about private credit is now leaking into regionals.
A look into ZION’s Form 8-K reveals the bank discovered misrepresentations, defaults, and other irregularities in two C&I loans, prompting a $60 million provision and $50 million charge-off, hitting ~7bps of CET1. Legal action has begun in California, though the bank claims this is “isolated” and plans an independent review. In short: while the Oval Office plays politics and chaos spreads geopolitically, the financial system quietly rehearses its next regional banking scare.
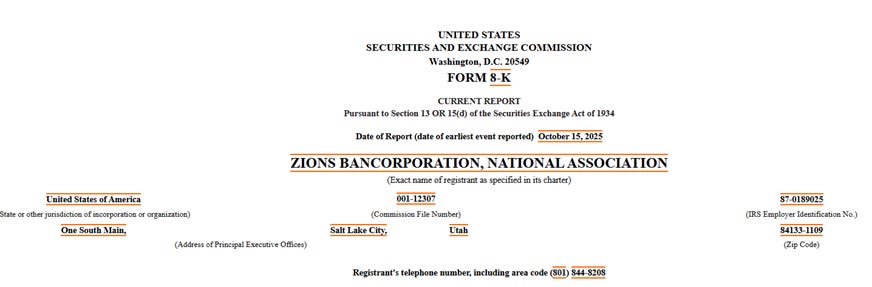
https://www.sec.gov/ix?doc=/Archives/edgar/data/109380/000010938025000118/zion-20251015.htm
‘The heir of JP Morgan’ who is completing a $3.0 new building to bring back everyone work from the office, recently reminded everyone that there are more “cockroaches” lurking.
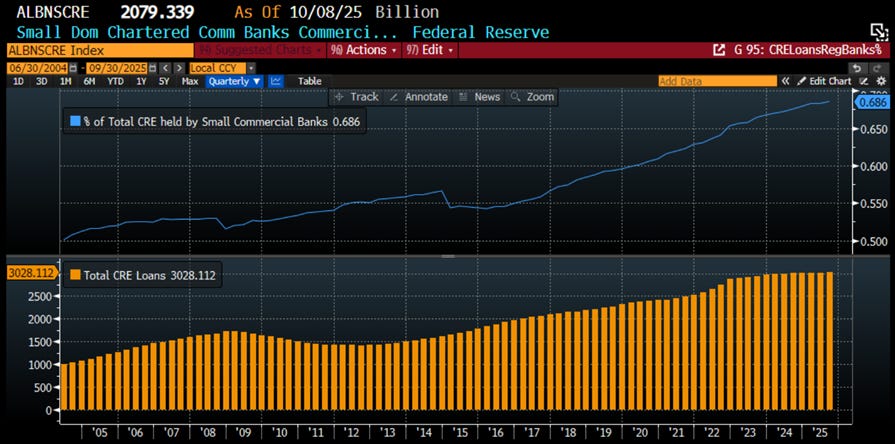
After the Tricolor/First Brands debacle, investors aren’t asking if one bad loan could spread—they’re asking: How did this even get through underwriting? Why are three unrelated potential frauds showing up in six weeks? Are small banks loosening standards just to juice growth? Surprise, these are mostly NDFI loans (~15% of regional portfolios), wildly inconsistent in quality, with private credit in the spotlight. Nobody really knows what’s going on, but the market sure is acting like it does.
Upper Panel: % of Total Commercial Real Estate loans held by small commercial banks (blue line); Lower Panel: Total CRE loans issued in the US (orange histogram).
Savvy investors watch the Fed Funds–SOFR spread like a canary in a coal mine. SOFR—the cost of overnight, Treasury-backed borrowing—reflects real, ultra-safe lending, while the Fed Funds Rate shows what banks charge each other for reserves. Normally, they move together, signaling smooth funding markets. But when the spread widens, it’s a red flag: banks are hoarding cash, collateral is tight, and trouble may be brewing. Historically, these divergences have foreshadowed everything from repo freezes to credit shocks, making the spread a subtle yet powerful early warning of financial chaos.
SOFR-Fed Fund Rate.
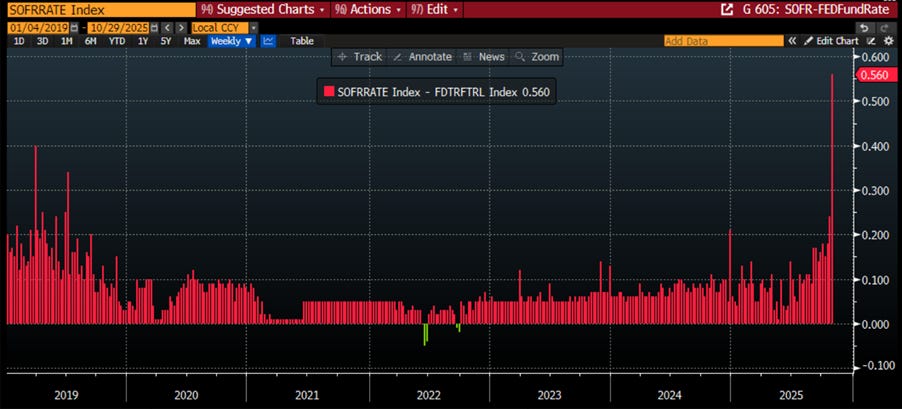
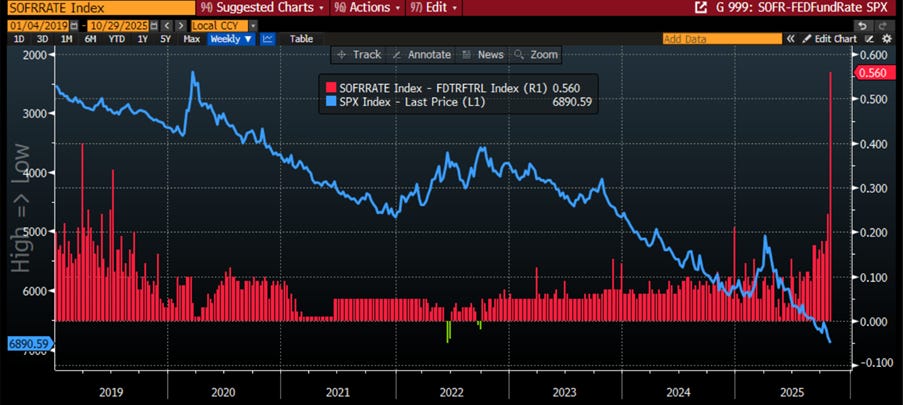
In plain terms: when the SOFR-Fed Fund rate spread spikes, it’s the financial markets’ way of politely saying, “Good luck, equities!”—historically, not exactly a harbinger of stellar returns.
SOFR-Fed Fund Rate (histogram); S&P 500 Index (axis inverted; blue line).
Read more and discover how to trade it here: https://themacrobutler.substack.com/p/fed-and-furious-breaking-the-econ…
Join The Macro Butler on Telegram here : https://t.me/TheMacroButlerSubstack
You can contact The Macro Butler at info@themacrobutler.com

Disclaimer
The content provided in this newsletter is for general information purposes only. No information, materials, services, and other content provided in this post constitute solicitation, recommendation, endorsement or any financial, investment, or other advice.
Seek independent professional consultation in the form of legal, financial, and fiscal advice before making any investment decisions.
Always perform your own due diligence.