Technicals Turning Positive
Welcome to MktContext! I am a professional money manager, trader, and investor who has been timing and beating the market for over a decade. We specialize in predicting market direction by studying the economy and market signals. Join 10,000 subscribers at MktContext.com in improving your portfolio returns — it’s free!
The first thing we’d point out is the technical gap fills on the SPX chart. The CPI disinflation news and China deal news in Oct left a series of overnight gaps in the price chart of SPX (below). We explained here what gaps are and why they get filled: they’re areas where no one transacted and therefore few buyers will step in.
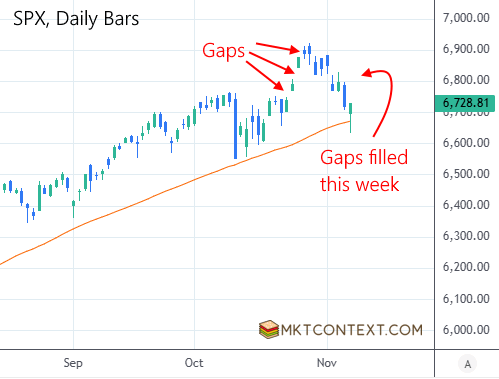
You’ll notice in the above chart that SPX bounced cleanly off the 50-day moving average (orange line) after a -1.5% intraday selloff, then proceeded to close green on the day. This left a long tail or “hammer candle” on Friday, indicating strong buying support at those levels.
When you amalgamate the positioning, liquidity, macro, and technical data, it suggests that we just went through a short-term speed bump that saw SPX drop -4% (and QQQ -6%) from highs. No reason to believe that a fundamental shift in market structure has occurred. As long as the 50-day moving average continues to hold, we remain bullish and buyers of any dips.
Positioning and Breadth
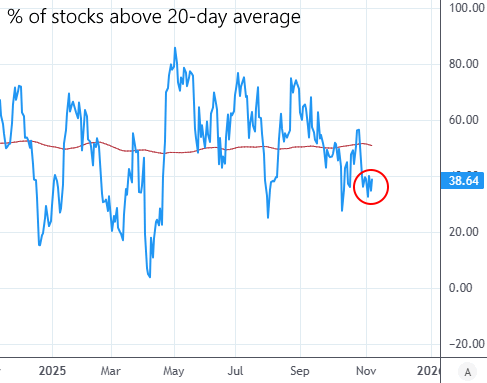
The technical picture is consistent with a wipeout. Below is market breadth (as measured by the number of stocks above their respective 20-day moving averages). It has fallen to a level that could be due for a bounce. It is not at the very lows, but we wouldn’t expect it to be — so far this has been a minor pullback in the middle of a longer bull market.
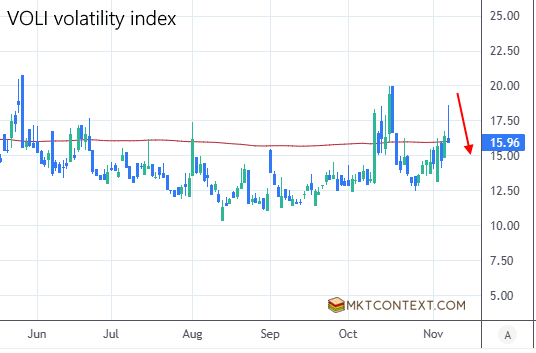
Volatility is behaving well: It spiked in the morning on Friday, but has reverted since:
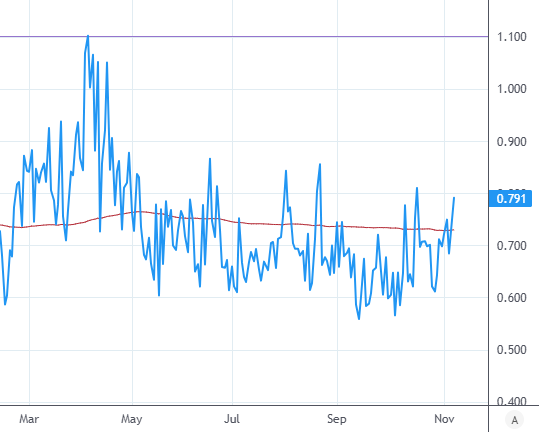
Despite the heavy selling of the past two trading days, the Put/Call ratio (measuring demand for downside insurance) failed to make new highs. That means the selling has not been driven by panic, so the recovery can probably continue:
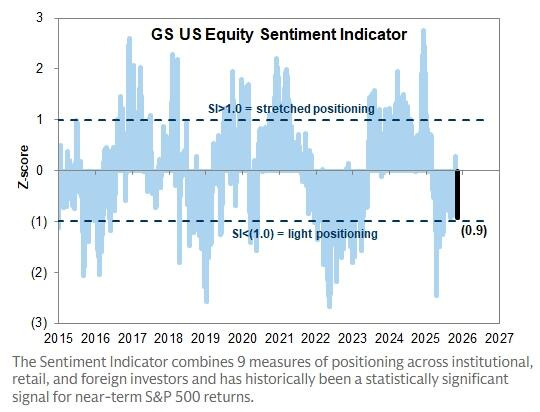
Positioning has been reset, with hedge fund and asset manager flows sharply negative over the past week, particularly in tech stocks. Here is the equity sentiment indicator at 1 standard deviation below average:
And as we mentioned earlier, the bounce off the 50-day average and hammer candle are both bullish signs. These are all technical signs that the market is due for a bounce. Granted, we’re not at “bloodbath lows” like we were in April this year or August 2024, but for a run-of-the-mill 4% selloff, this is a buyable dip.
To read the rest of this article, and to see our portfolios and get more market timing content, head over to MktContext.com and subscribe today!