
MSA: Gold, Silver to Take Lead Over Stocks Now
Silver and Gold: The Structural Turn Begins
Authored by GoldFix
According to a report by Momentum Structural Analysis (Michael Oliver), Gold and silver are entering a major secular advance supported by long-term momentum structures and multi-year relative-performance bases. frames the current alignment of signals as the early stage of a large asset-allocation rotation away from equities and toward monetary metals.
He highlights spread breakouts, reaffirmed momentum floors, and synchronized behavior across gold, silver, and miners.
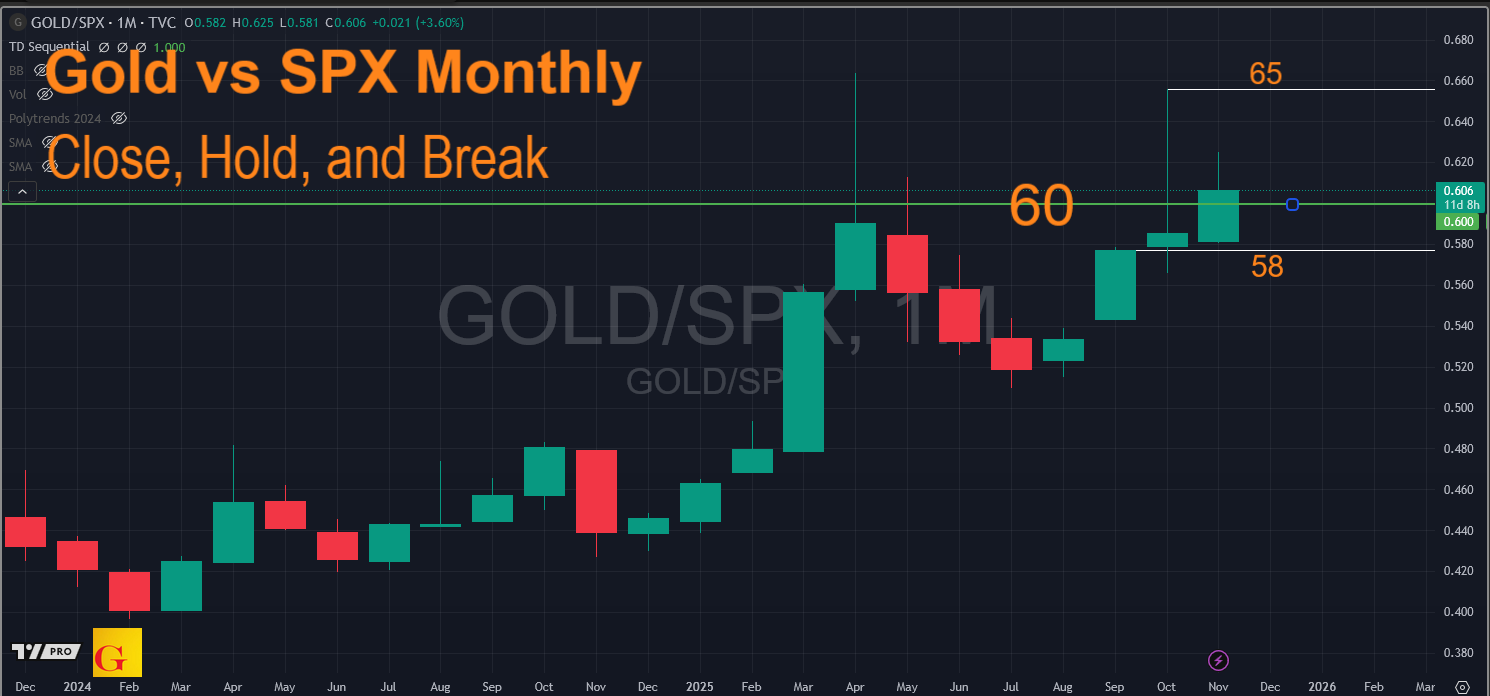
The most decisive evidence of this occurs on the gold versus S&P 500 spread chart. The spread pulled back to long-standing support earlier this year and then pivoted sharply higher. Michael writes:
“Close out the month at 60 percent or higher and assume not only that gold is going to outperform, but also that the massive eleven-year-wide basing of performance action is engaging fully into an uptrend.”
Note: Jordan Roy-Byrne (link to free book..we contributed a chapter and recommend it) at the Daily Gold has been making similar observations, and has been focused on Gold vs the 60/40 portfolio for some time seeing its own break out in past months.. becoming just as bullish. Michael here is declaring the momentum is very close to beginning for even more explosive action
Gold: Relative Breakout and Secular Implications
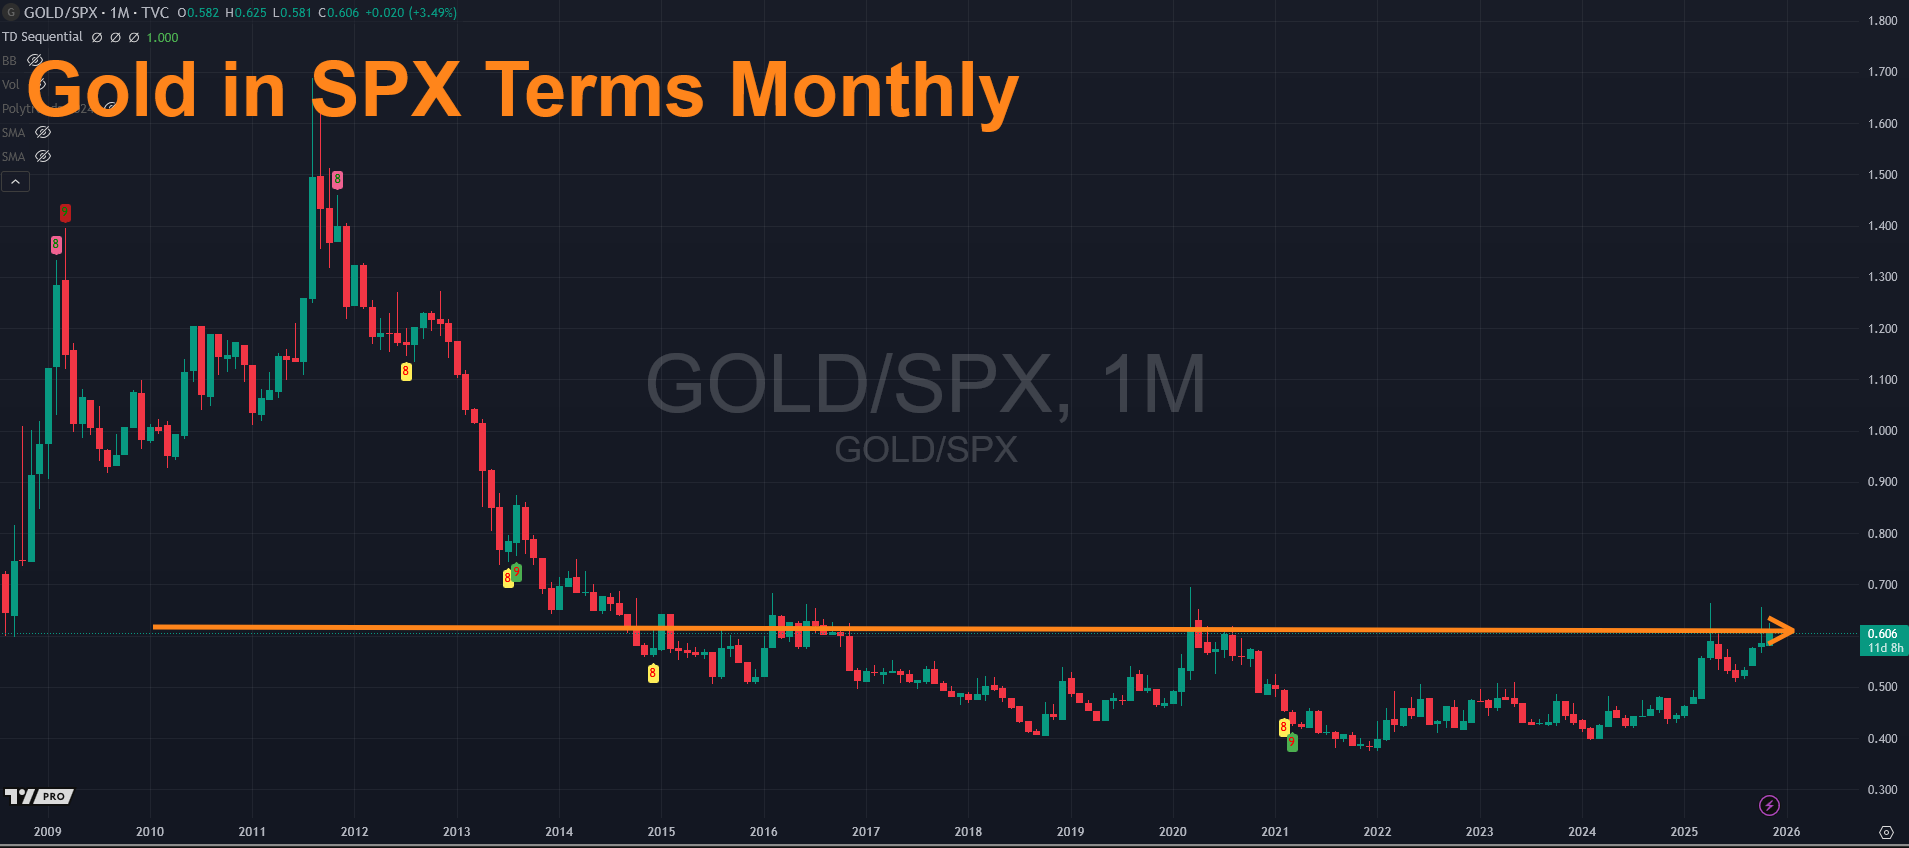
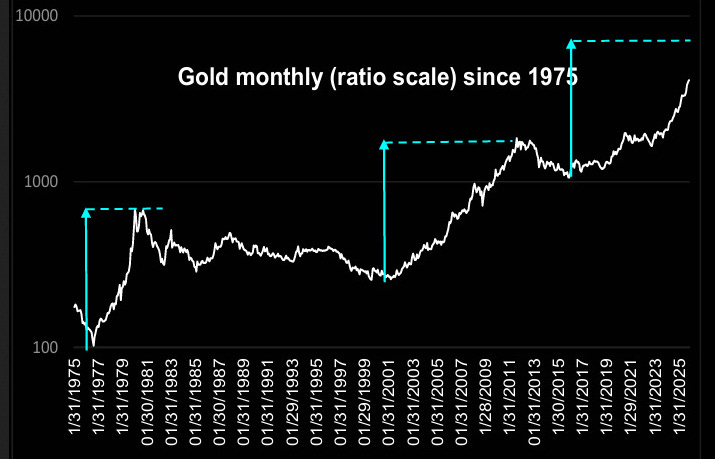
MSA treats the gold relative-performance breakout as the central development for monetary metals. The structure held firm at the green support line, then surged through overhead containment. Michael emphasizes that this shift is only beginning, not ending. He compares the current cycle with the previous bull markets since gold was legalized in 1975. During each of the two prior full cycles, gold advanced by a factor of eight from bear lows to bull peaks. The current rise is only a four-fold move off the 2015 low near 1050.
MSA asks seemingly rhetorically: “Do you think it could at least match those gains, meaning 8000 plus?” He presents this as a structural inference supported by repeated long-term behavior.
He notes that gold has already broken out relative to the Dow 30 and NYSE Composite. The S&P 500 is the last barrier, and it is close. Michael states that the move will “signal the onset of a massive shift out of stocks and into monetary metals” once confirmed. He also argues that such an event will likely “signal events and trend breakages in economic and market areas that will totally upset investor expectations and create panic in the central banks.”
Silver vs Gold: The Secondary Explosive Signal
MSA places silver’s relative-performance setup immediately behind gold’s breakout. Michael views silver as the larger opportunity once the gold-versus-S&P signal finalizes. The silver-to-gold spread tested a downtrend from late 2020, backed off briefly, and then exceeded the October closing peak. That move represents the first step.
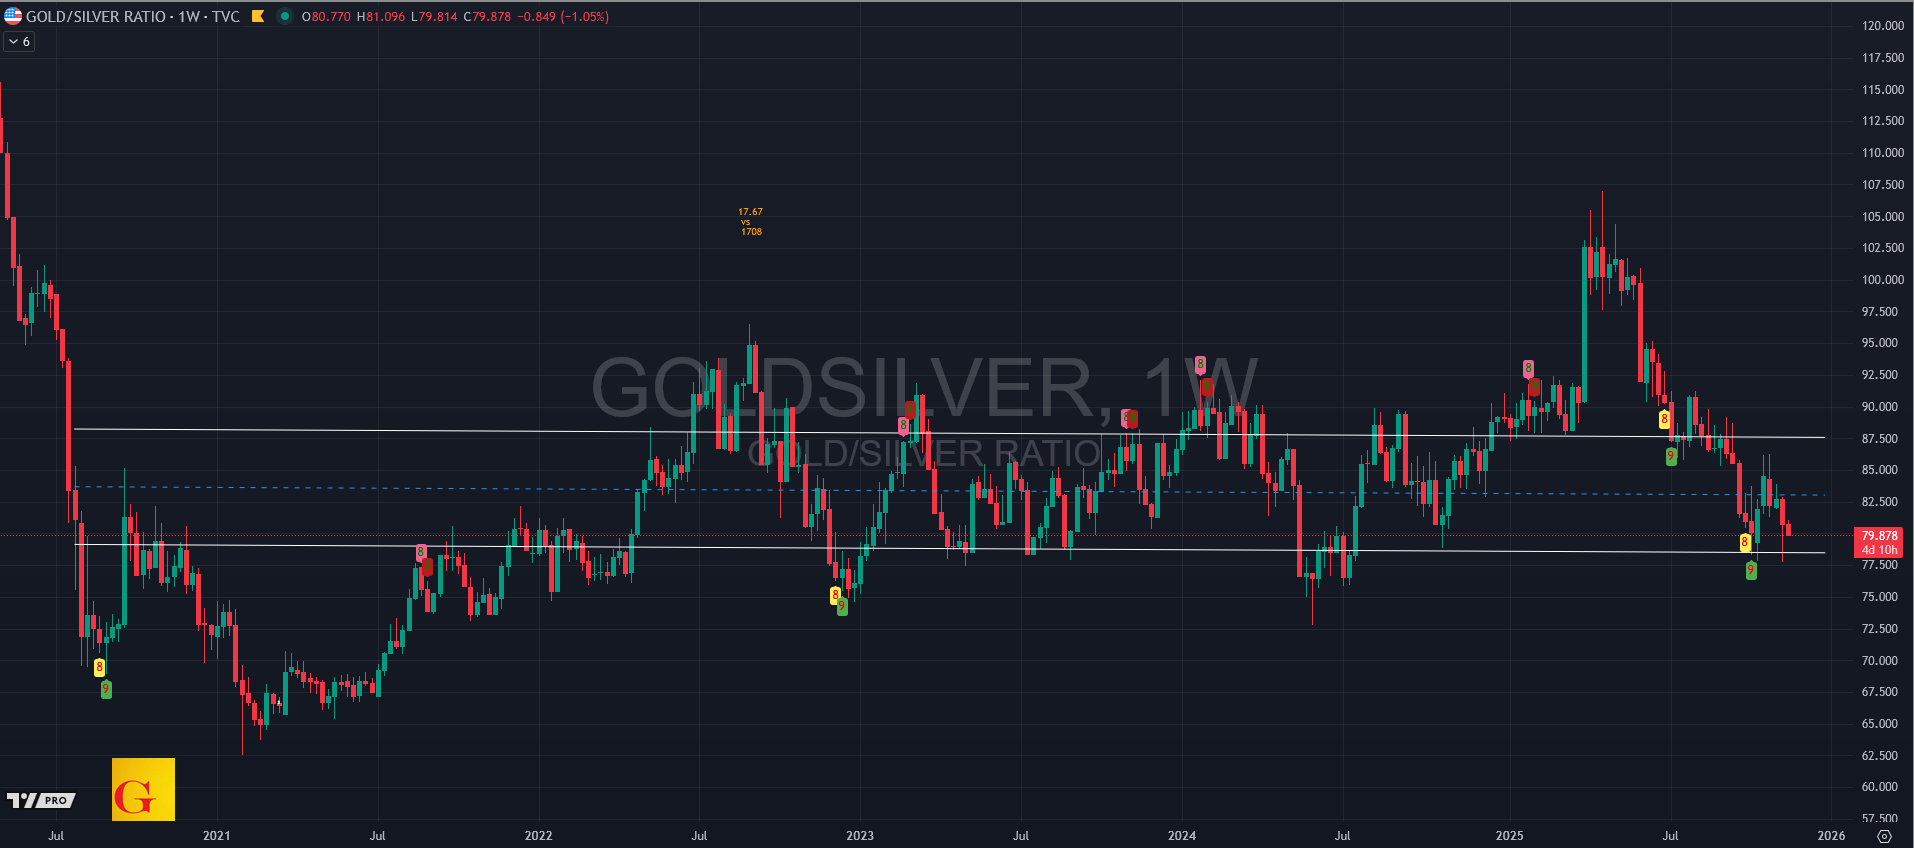
The key horizontal level on the spread chart is the three-and-a-half-year ceiling near 1.32 percent. Michael specifies that “close out a week at 1.25 percent and its momentum action will break out over its multi-year ceiling.” The spread ended last week at 1.238 percent
Once momentum clears this ceiling, MSA advises that investors should “set your clock for about two quarters into the future.” In that window, Michael expects silver to accelerate very rapidly. He avoids precise targets but states that “achieving a new reality, for example 200 dollars plus, would not at all surprise us.”
Silver Weekly Momentum and Volatility Reclaim and Strength
The weekly momentum structure in silver mirrors GDX but with greater force. The October decline flushed out late entrants and frightened holders, but Michael notes that closing any day above 48.15 last week would turn momentum up. Silver finished the week gaining 5.28 percent even though equities were down.
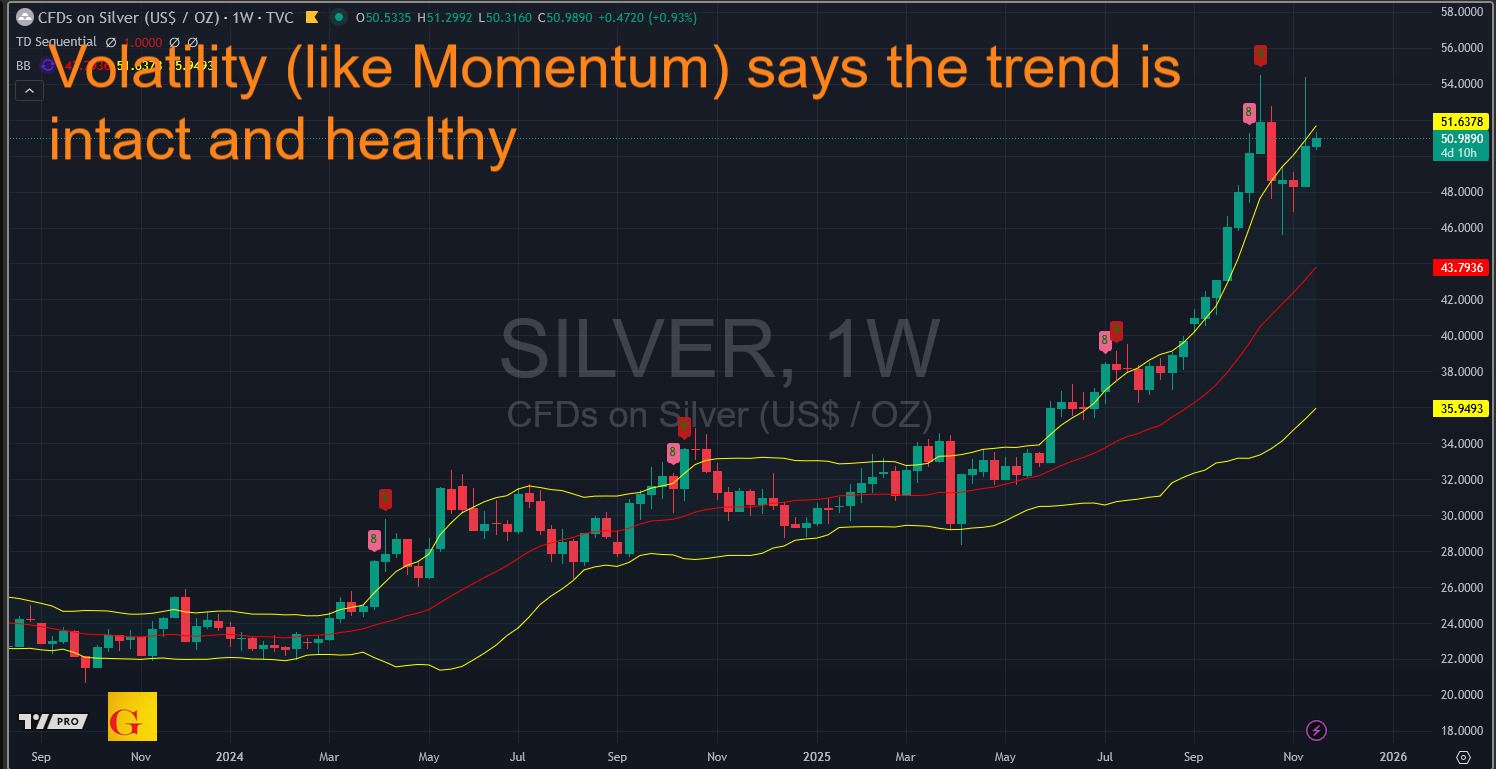
MSA rejects the idea that stock weakness must drag silver lower. [Another correaltion that will break when this gets going- VBL] He labels the October selloff “totally insignificant” for long-term momentum. The zero-line structure was fully reset during the pullback and then reclaimed quickly. This pattern signals renewed strength.
- Video chart walkthrough here
Continues here.
Free Posts To Your Mailbox