
Goldman Sachs 2026 Commodities Outlook
Posted on the TightSpreads Substack.
Daan Struyven and Samantha Dart Research
The US-China AI and geopolitical power race and global energy supply waves drive our key convictions, including our long gold call, the hedging value of commodities, and our relative value views on energy and industrial metals.
On the macro side, the US-China AI and geopolitical power race drives:
Our long gold trade recommendation as EM central banks diversify further into gold to hedge geopolitical risks. We still see upside risk to our base case that the gold price rises 14% to $4,900 by Dec26 from a potential broadening of diversification to private investors.
The insurance value of commodities in portfolios as growing supply concentration, US-China competition, and other geopolitical conflicts raise disruptions risks (as happened to rare earths).
Our long copper, short aluminum (Dec27) trade as the price ratio between copper--which faces mine supply constraints--and aluminum is likely to make new highs as electrification boosts copper demand while China’s overseas push for security of supply boosts aluminum supply.
Our US power market tightening call as the US data center and power demand boom is set to further tighten US power markets, which are at risk of much higher prices, outages, and bottlenecks slowing down AI progress.
On the micro side, two large energy supply waves--a short-lived oil 2025-2026 wave but a long-lasting LNG 2025-2032 wave--drive our energy calls:
Our 2026 oil surplus trade recommendation (short 26Q3-Dec28 Brent timespread) as the last big supply wave keeps the market in surplus and likely reduces Brent/WTI to 2026 averages of $56/52.
Our global gas glut trade recommendation (27Q3 short European natural gas (TTF)) as the largest LNG supply wave ever likely reduces TTF prices near 35% by mid-2027.
2026 Outlook: Ride the Power Race and Supply Waves
Commodity indices have delivered strong total returns in 2025 (e.g. BCOM 15%) because very strong returns in industrial and especially precious metals, which both tend to benefit from Fed cuts, have outweighed modestly negative returns in energy. Our cyclical macro base case (link) of sturdy global GDP growth and 50bp of Fed rate cuts in 2026 is again supportive of top-down commodity returns. However, we believe that two major structural trends will drive the outlook for commodities, with a base case where commodity index returns moderate (Exhibit 15), but with again significant return differentiation across commodities and relative value opportunities:
First, on the macro side, commodities will likely remain at the center of the US-China race for geopolitical power and for tech and AI dominance. As a result of this race, we:
Remain bullish on gold as China’s and other EM central banks, which remain underweight gold (Exhibit 1left panel) hedge geopolitical/sanctions risk by diversifying into gold
See significant portfolio insurance value from commodities as the risk of supply disruptions grows with US-China competition and other geopolitical and trade conflicts
Expect copper prices to outperform aluminum prices as China’s overseas push for security of critical metals supply boosts aluminum production
Believe the acceleration in power demand in the US--the front runner in the data center race (Exhibit 2right panel)--will tighten US power markets
Exhibit 1: Upside to China/EM Central Bank Gold Reserves From Diversification; China Leads Refining of Critical Minerals While the US Has More Data Center Capacity
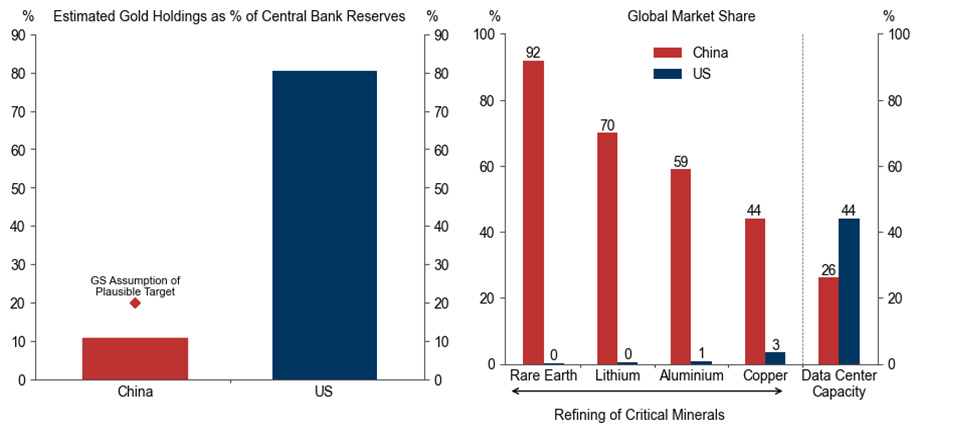
Source: IMF, IEA, Wood Mackenzie, Goldman Sachs Global Investment Research
Second, on the micro side, two large energy supply waves that started in 2025 drive our energy calls. While 2026 is the last year of the oil supply wave[1], the LNG supply wave is much longer with a predicted surge in LNG exports of over 50% in 2025-2030. As a result, we recommend two energy trades:
2026 oil surplus trade (short 26Q3-Dec28 Brent timespread)
Global gas glut trade (short 27Q3 European natural gas (TTF))
Exhibit 2: A Short-Lived 2025-2026 Oil Supply Wave But a Long-Lasting and Large LNG Supply Wave
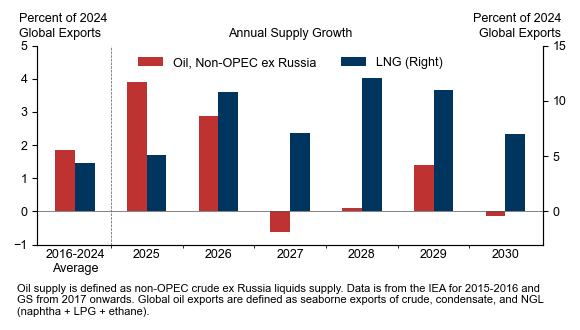
Source: IEA, Kpler, Goldman Sachs Global Investment Research
Exhibit 3: Our Highest Conviction Trades Are Long Gold and Short Long-Dated European Natural Gas
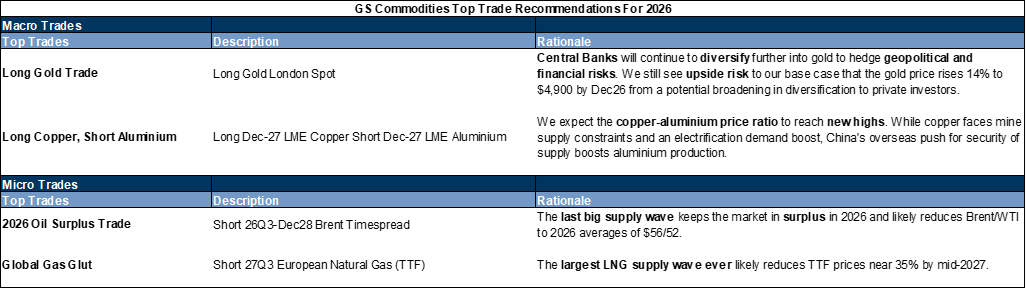
Source: Goldman Sachs Global Investment Research
The Geopolitical Power and AI Race Between the US and China
Long Gold
The gold rally accelerated in 2025 (up 64% YTD) as falling US interest rates led ETF investors, who were net gold sellers in 2022-2024, to start competing for limited bullion with central banks (Exhibit 4). We expect the same two drivers--structurally high central bank demand and cyclical support from Fed cuts--to lift the gold price further to $4,900/toz by Dec26. We thus continue to recommend long exposure in gold.
Exhibit 4: The Gold Rally Accelerated in 2025 as Both Sticky High Conviction Buyers--ETF Investors and Especially Central Banks--Started Competing for Limited Bullion
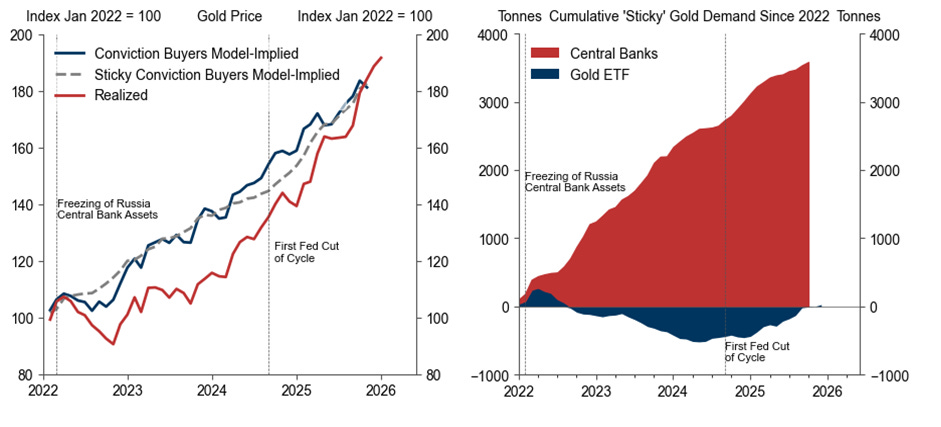
Our pricing framework features conviction buyers--ETFs, central banks, speculators--who buy irrespective of price on a macro-or risk hedging view, while opportunistic buyers--households in emerging markets--step in when the price is right (see \”Precious Analyst: Gold Market Primer\”). The conviction buyers model-implied estimate accounts for gold demand from central banks, ETFs, and speculators. The sticky conviction buyers model-implied estimate only accounts for gold demand from central banks and ETFs, whose holdings are stickier/less volatile than for speculators.
Source: Bloomberg, Goldman Sachs Global Investment Research
We expect central bank gold buying to remain strong in 2026, averaging 70 tonnes per month (close to its 66 tonnes 12-month average, but 4 times above the 17 tonnes pre-2022 monthly average), and contribute about 14pp to our predicted price increase by Dec26 for three reasons. First, the freezing of Russia’s reserves in 2022 was a sea change in how EM reserve managers perceive geopolitical risks. Second, the estimated gold reserve share of EM central banks such as the PBoC remains relatively low vs. global peers (Exhibit 1, left panel), especially given China’s ambition to internationalize the RMB. Third, surveys show record high central bank gold appetite.
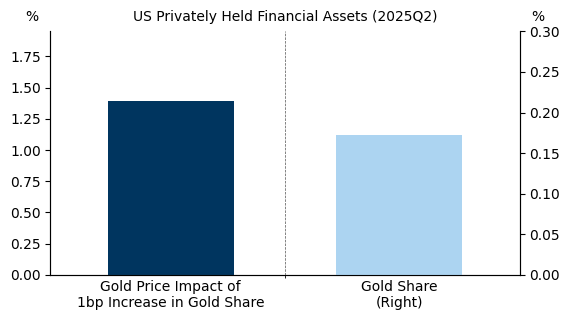
We see upside risk to our gold price forecast from a potential broadening of diversification to private investors. Gold ETFs account for just 0.17% of US private financial portfolios, 6 basis points below its 2012 peak. We estimate that every 1bp increase in the gold share of US financial portfolios--driven by incremental investor purchases rather than price appreciation--raises the gold price by 1.4% (Exhibit 5).
Exhibit 5: We Estimate That Each 1bp Increase in Gold’s Share of US Financial Portfolios--Driven by Incremental Investor Buying--Lifts the Gold Price by About 1.4%
We calculate the gold ETF share in privately held financial portfolios as: gold ETF share = US gold ETF market cap ÷ US financial portfolios, where financial portfolios are defined as privately held debt securities and corporate equities based on US Flow of Funds data. We include all sectors excluding federal government, state & local government, monetary authority, US depository institutions, foreign banking offices, and rest of world.
Source: Federal Reserve Board, Goldman Sachs Global Investment Research
Insurance Value of Commodities
Even as gold remains our single favorite long commodity, we see a strong role for broader commodity length in strategic portfolio allocations. The very high geographic concentration of commodity supply and the increasing geopolitical, trade, and AI competition has led to a more frequent use of commodity dominance as leverage. This raises the risk of supply disruptions, which underscores the insurance value of commodities. Equity-bond portfolios are not well-diversified when commodity supply losses drive both weaker growth and higher inflation as well as strong commodity returns.
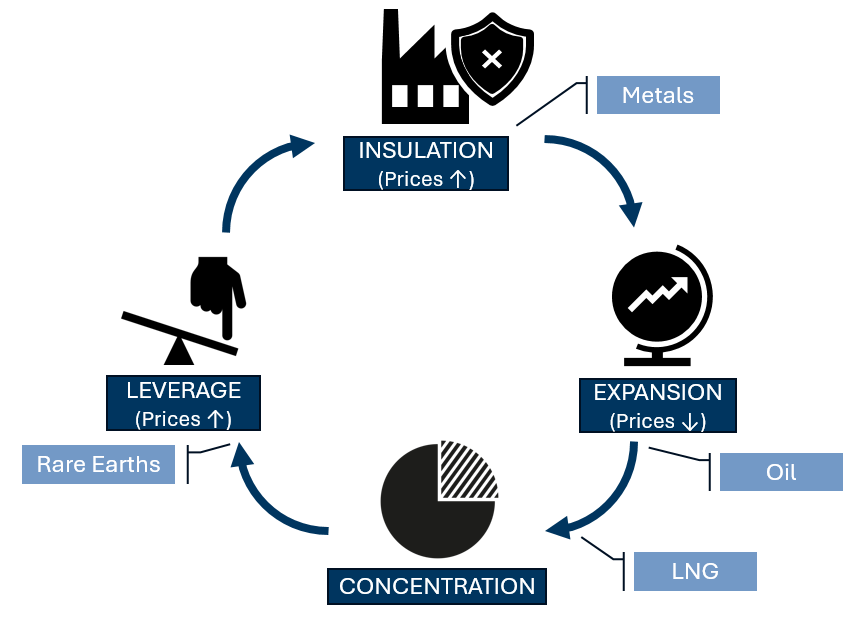
China’s restrictions of exports of rare earths, which are vital for the production of semiconductor chips, AI, batteries and defense equipment,[2] fit in our commodity control cycle framework (Exhibit 6). In this cycle, as globalization stalls and countries turn increasingly inward, they typically 1) insulate/reshore commodity supply chains through tariffs, subsidies, and investment (copper and aluminum are in this phase), 2) expand production (oil and LNG are in this phase), 3) raise supply concentration by forcing high-cost producers elsewhere to exit, and 4) use dominant supply as leverage (as happened to rare earths).
Exhibit 6: As Countries Turn Increasingly Inward, Commodities May Take On a More Strategic Role And Move In a Recurring 4-Step “Commodity Control Cycle”, Already Visible Across Commodity Markets
Source: Goldman Sachs Global Investment Research
Beyond rare earths, we see supply disruptions risks in coming years for other critical minerals, natural gas, and oil.
China has built up dominant market shares in refining of many minerals (Exhibit 1), including lithium (critical for storing energy and modernizing the grid), copper (critical for distributing power locally), and aluminum (critical for transmitting power over long distances).
We expect the LNG supply wave to reshuffle but not reduce Europe’s natural gas import dependence. In 2022 Russia--then supplying 40% of Europe’s gas--curtailed flows to Europe. While our base case is that a surge in US and Qatari cargoes will end Europe’s energy crisis, the potential rise in US/Qatari exports to 70/10% of European imports by 2030 recreates the potential for using gas as geopolitical leverage.[3]
While our 2026 base case is excess oil supply, disruptions from Russia, Venezuela, and Iran are risks to watch, especially with a moderation in OPEC+ spare capacity.
Exhibit 7: Commodity Supply Is Increasingly Concentrated
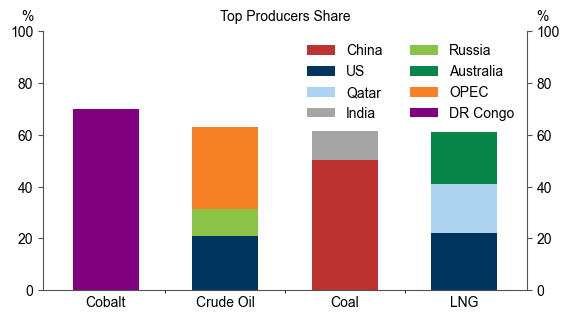
Source: IEA, EIA, National Mining Association, Goldman Sachs Global Investment Research
Long Copper, Short Aluminum
Copper remains our favorite long-run industrial metal because it faces unique mine supply constraints and structurally strong demand growth. We reiterate our $15,000 2035 copper price forecast, and continue to recommend our long copper, short aluminum (Dec27) trade because our forecast for aluminum is well below the entire forwards curve, while our copper forecast is above the forwards from 2028. While liquidity diminishes with the horizon, one alternative expression of this view would be to do the trade using the Dec28 contract, rather than the Dec27 contract from our current trade recommendation, as our 2028 copper view is more bullish than our 2027 view.
Copper Price Consolidates in 2026 as Tariffs Boost Appears Priced in
The copper price has rallied from $10,600 in November to $11,700 on the expectation that copper inflows into the US ahead of a potential tariff on refined copper further reduce ex-US inventories. As Exhibit 8 shows, ex-US inventories have better explained LME copper prices--which are set in London--in 2025 than global inventories, which are critical for prices in normal years and have risen year-to-date.
Exhibit 8: 2026 Ex-US Deficit Supports The $11,400 2026 Copper Price Forecast
The rest is available for Premium Subscribers.