The Significance of the LCOE Across Power Generation Types
From the TightSpreads Substack.
No shocker that global demand for power has been a headline for what seems like eternity. Power simply is no longer a utility expense—it is a strategic barrier to entry for many compounding verticals such as compute. While the Levelized Cost of Energy (LCOE) remains the foundational metric for evaluating power assets, its role has evolved from a simple "price tag" to a complex risk-assessment tool.
This educational primer reviews:
What an LCOE is, its significance in commercial contracting
How to calculate an LCOE
How they vary across generation types
How can they be manipulated in calculations
Resources to calculate LCOEs
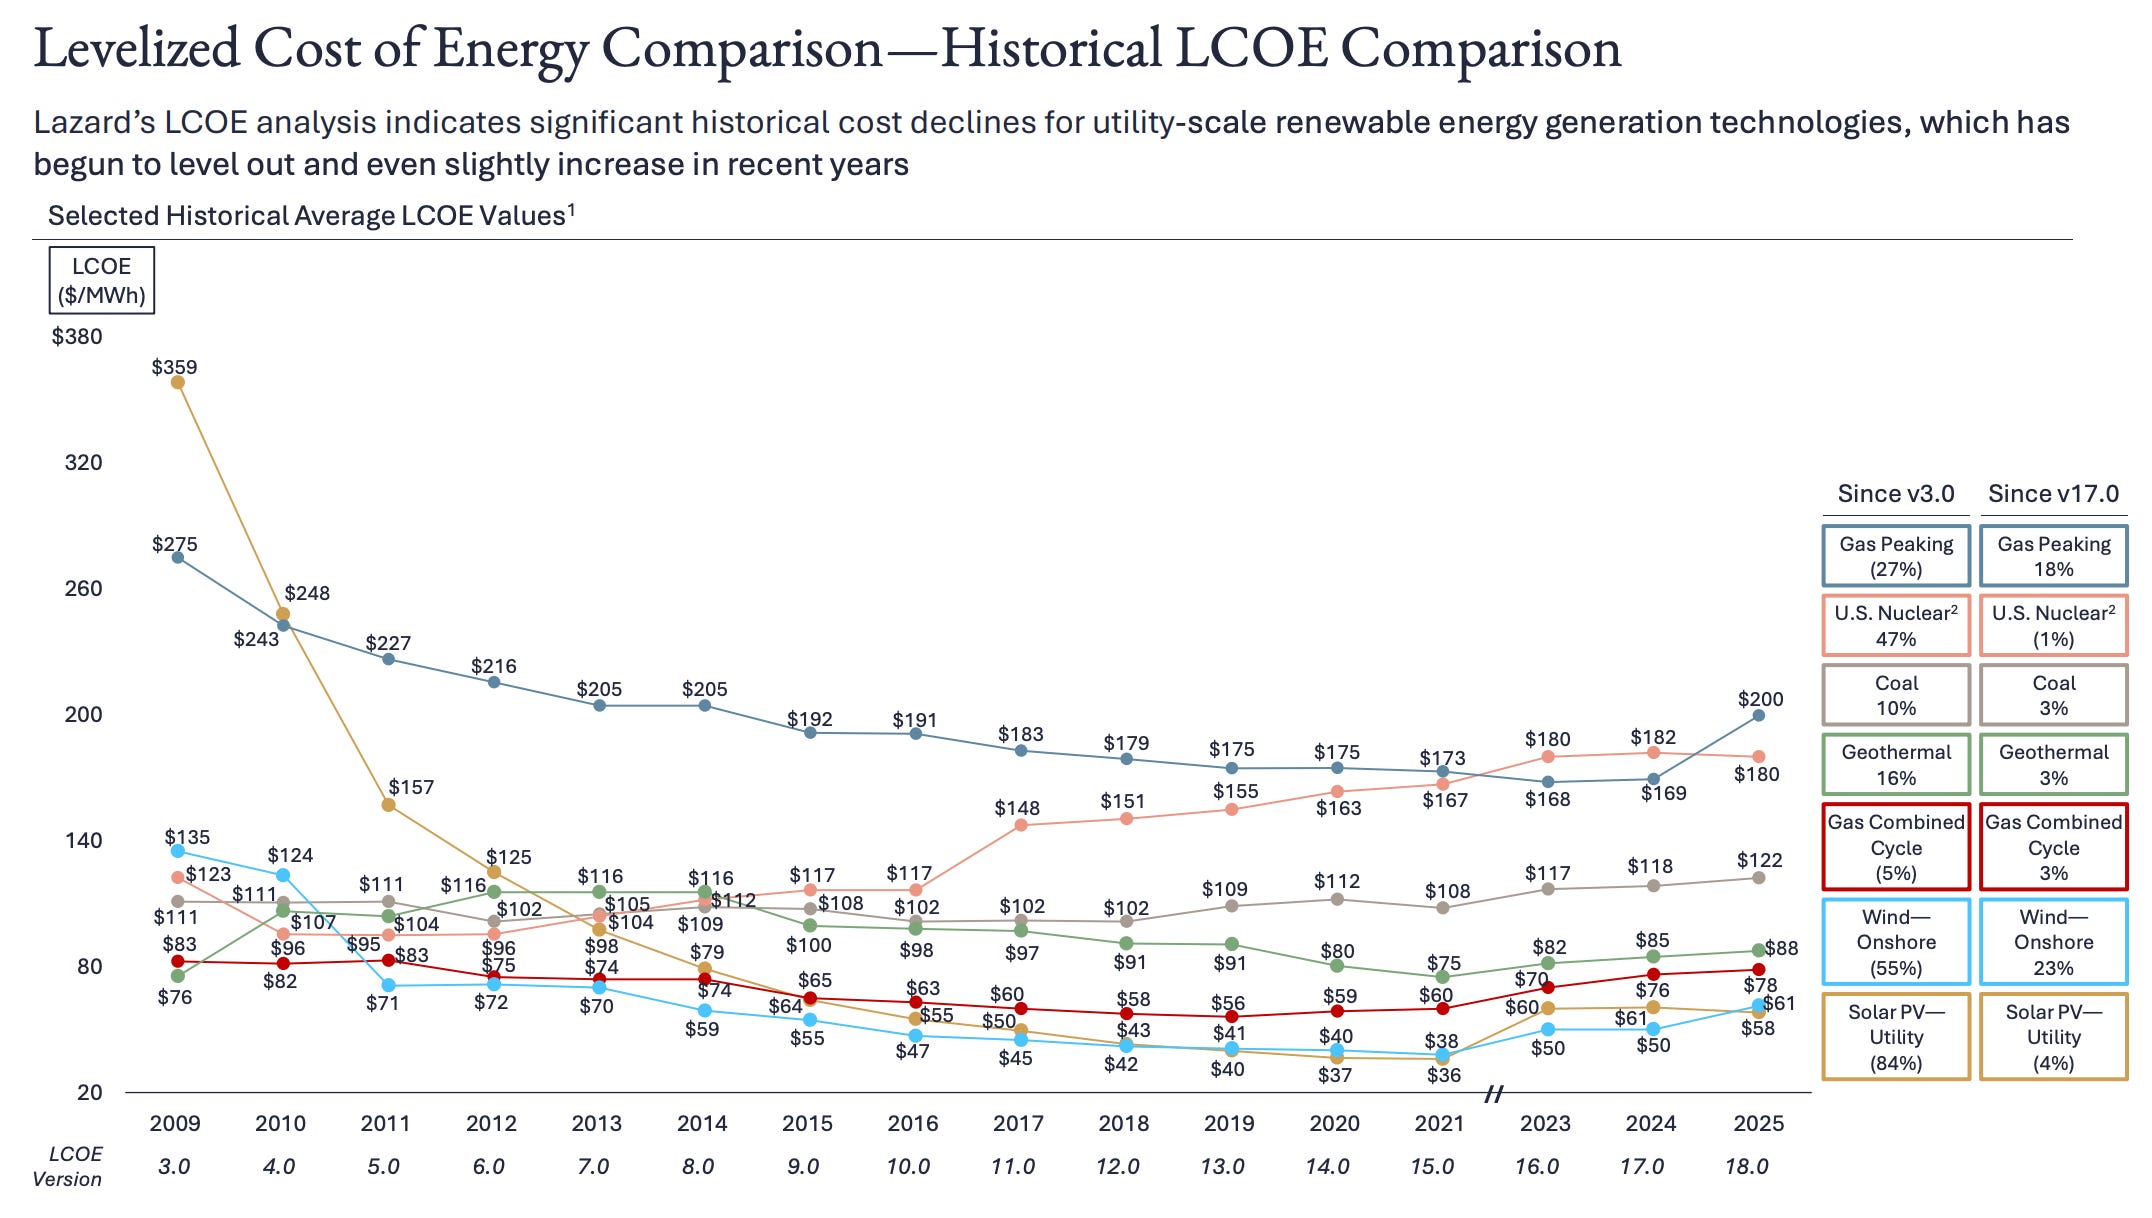
Lazard’s 2025 LCOE analysis
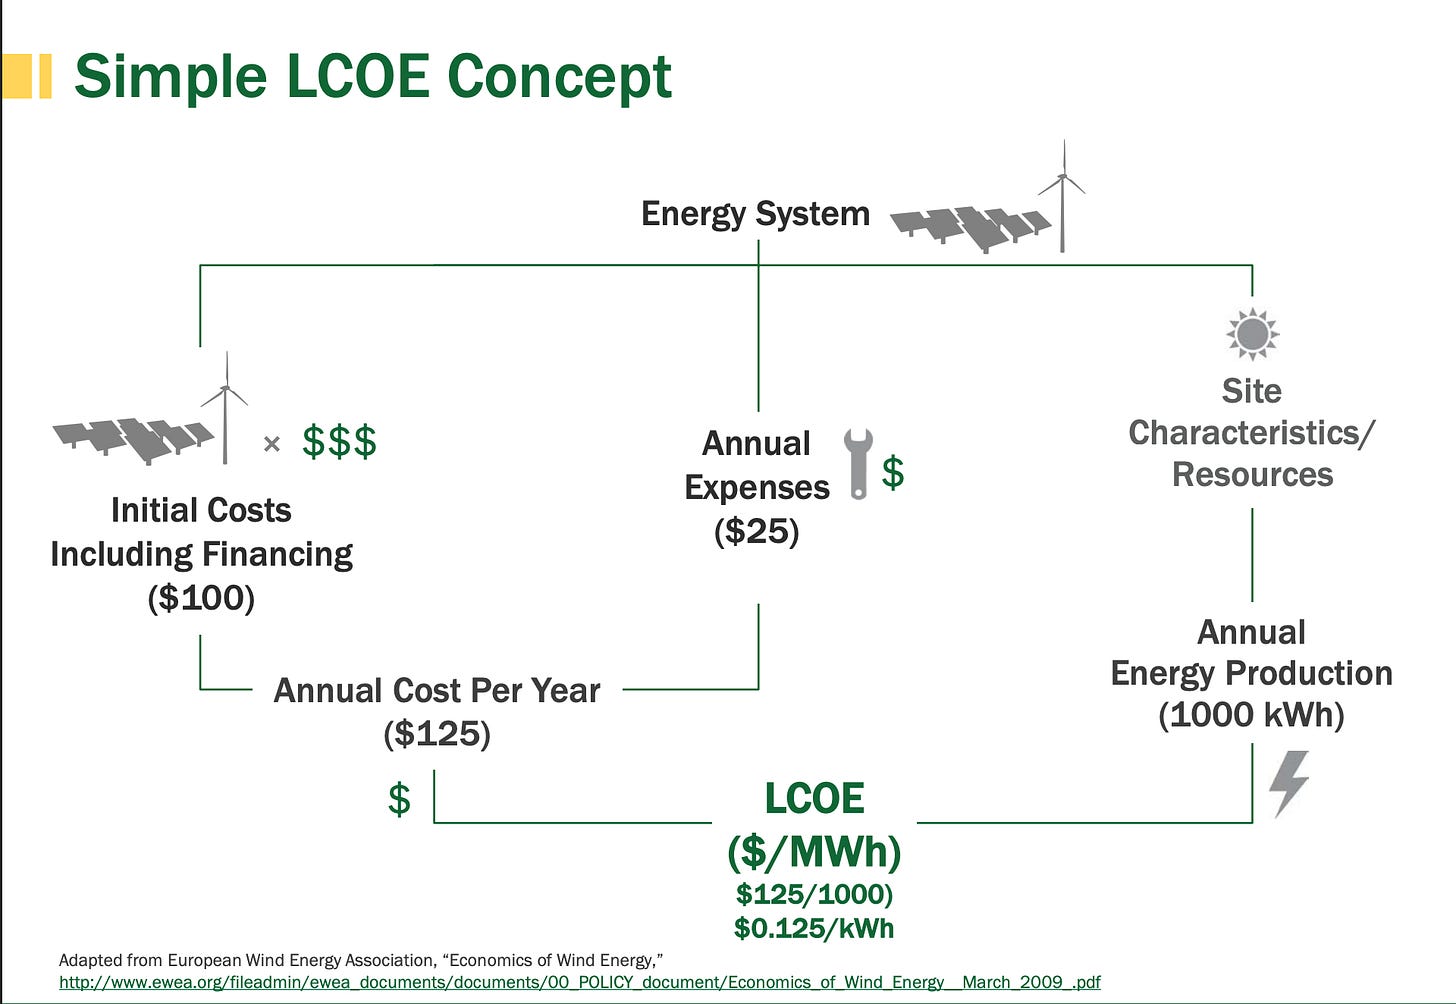
What is Levelized Cost of Energy
LCOE is the "break-even" price of electricity for a power-generating asset over its entire lifetime. Think of it as the average price per megawatt-hour (MWh) a plant must receive to cover every cent of its costs, including construction, fuel, and maintenance, while providing a target return to investors. It’s useful as it allows the comparison of different technologies (wind, solar, natural gas) of unequal life spans, project size, different capital cost, risk, return, and capacities. Therefore, it’s critical to making an informed decision as it relates to varying project power developments.
The Significance of LCOE
Historically, large purchase power agreements favored low carbon and cost energy sources such as wind and solar because they offered the lowest nominal LCOE. In 2025, the strategy has moved toward reliability and additionality.
How LCOE Considerations are Present in Contracts
Hyperscalers are realizing that a “cheap” solar MWh produced at noon is worthless if their data center needs power at midnight, and the same for wind MWh that are likewise uncontrollable and unpredictable. Hyperscalers are increasingly willing to pay a reliability premium for nuclear power and ‘dirty’ assets such as natural gas and coal . While nuclear LCOE is significantly higher than solar ($70-$90/MWh vs $30/MWh), its 92% Capacity Factor means it produces a predictable, 24/7 stream of carbon-free energy. Deals are also increasingly contracted as "Behind-the-Meter" contracts where hyperscalers co-locate data centers directly at generation sites to bypass the grid entirely. We’ve seen this with large nuclear deals with Constellation and Vistra Energy.
The strategy for contracting power has shifted significantly from chasing the cheapest nominal MWh toward ensuring “additionality” and “24/7 reliability.” Historically, hyperscalers favored wind and solar for their low LCOEs, often dipping below $30/MWh. Today, the focus is on a new metric: the Levelized Cost of Energy Utilized (LCOEu). This refinement only accounts for the power that actually meets a data center’s load, effectively penalizing “cheap” solar that is produced at noon when it may not be needed. This shift explains why hyperscalers are increasingly willing to sign Power Purchase Agreements (PPAs) for Solar + Storage projects—even at a higher LCOE of $45 to $60/MWh—and are aggressively pursuing nuclear power. Despite a significantly higher LCOE of $70 to $90/MWh, nuclear’s 92% capacity factor provides the predictable, carbon-free baseload required for AI uptime. We are seeing a surge in “Behind-the-Meter” deals where data centers co-locate directly at nuclear sites to bypass the grid entirely.
Conceptually thinking about managing LCOE and Barriers with Grid Connection
It is essential to compare LCOE against the Levelized “Avoided Cost” of Electricity (LACE). While LCOE tells you what it costs to build a plant, LACE measures what the hyperscaler would have otherwise paid to buy that power from a volatile grid. In high-priced markets like PJM, where capacity prices have recently skyrocketed by over 300%, the “Avoided Cost” is so high that even ostensibly expensive geothermal or nuclear projects become economically attractive. The EIA provides a specific "Levelized Avoided Cost of New Generation" table broken down by the 22 electricity market regions. If you want the most granular LACE data used for official contracting, look at Integrated Resource Plans (IRPs) filed by major utilities within those RTOs.
Furthermore, the primary constraint in 2026 is often not the cost of technology, but the “soft costs” of interconnection and transmission. With significant lead times for transformers, a project with a slightly higher LCOE that can connect to the grid immediately is often more valuable than a cheaper project trapped in a five-year permitting queue. Ultimately, the winners in this power arms race are those who can balance low-cost generation with the physical certainty of delivery.
LCOE conceptually:
LCOE as a formula:
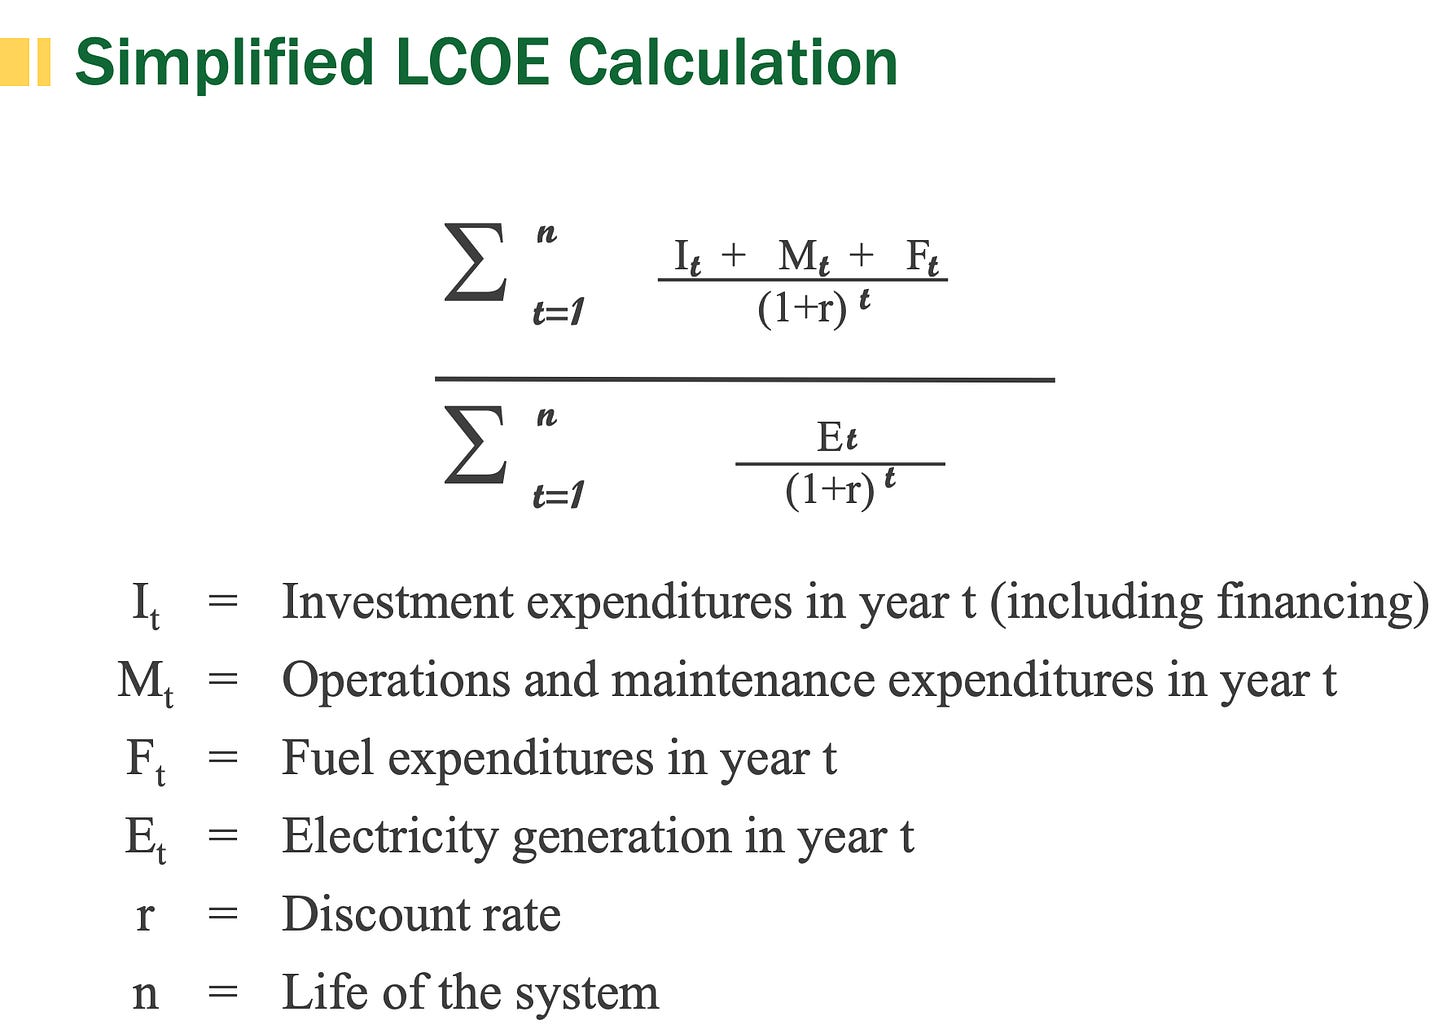
How to Calculate LCOE
At first glance, you may think there is a lot going on in this formula. Seemingly big, scary variables with deeper meaning. It’s quite simple:
The numerator is everything you spend over the life of the project, discounted back to today’s dollars:
I(t)(CapEx): The “Down Payment.” Building the plant, buying the turbines/panels, and paying the engineers.
M(t) (OpEx): The “Utility Bills.” Fixing broken parts, paying staff, and property taxes.
F(t) (Fuel): The “Gas Tank.” Constant for natural gas, zero for wind/solar, and a small but steady cost for nuclear.
The denominator is the total energy the plant produces, also discounted back to today:
E(t): How many MWh the plant actually puts onto the grid.
Example:
Quick LCOE for a 100 MW Utility-Scale Solar Project
Nameplate Capacity: 100 MW.
Degradation Rate: 0.5% per year
CapEx I(t): $100 million ($1/watt).
ITC (Investment Tax Credit): 30% (Reduces initial cash outlay to $70M).
Capacity Factor: 25% (Typical for a sunny region).
Capacity Factor measures how hard a plant is working compared to its theoretical maximum. Think of it as the "occupancy rate" of a power plant.
Math = Actual MWh produced / Max potential energy (aka nameplate MWh * hours in a period)
Why It Matters: It separates intermittent sources (wind/solar) from baseload sources (gas/nuclear). A 500 MW wind farm does not equal a 500 MW nuclear plant. Solar is only productive during variable sunlit exposed hours, nuclear is 24/7 baseload with pre-determined maintenance and refueling periods.
OpEx, fixed M(t): $1.5 million/year.
Fuel F(t): $0 (The ‘Solar Advantage’).
Life (n): 25 years.
Discount Rate (r): 7% (hurdle rate).
Step 1: Calculate Net CapEx (Year 0 Outlay)
Gross CapEx: $100,000,000
Less: ITC (30%): ($30,000,000)
Net Investment: $70,000,000
Step 2: Calculate PV of Lifetime OpEx (The Numerator Adjustment)
We treat the $1.5M annual cost as a 25-year annuity discounted at 7%
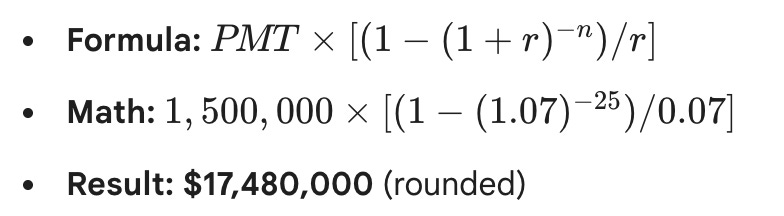
Step 3: Total Present Value of Costs
Net CapEx + PV of OpEx: $70,000,000 + $17,480,000
Total PV Costs: $87,480,000 (Numerator)
Step 4: Calculate Discounted Lifetime Energy
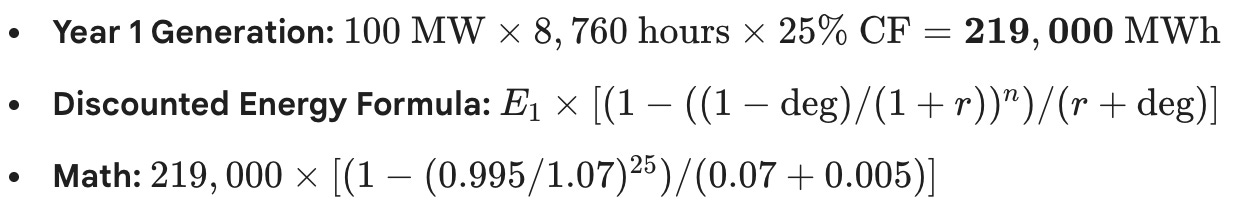
Result: ~2,400,000 MWh (The Levelized Energy aka Denominator)
Final LCOE Result
LCOE = Total PV Costs / Total Discounted MWh
LCOE = $87,480,000 / 2,400,000 MWh
LCOE = $36.45 / MWh
Important notes:
Discount Rate Sensitivity: Because solar is almost all “front-loaded” CapEx, a move from 7% to 8% discount rate will spike this LCOE significantly.
The Spread: If the project is located in a market (like PJM) the average cost of wholesale power in PJM jumped 49% in 2025 to $82.67/MWh, the project generates a significant “Spread” of $46.22/MWh over its life usig today’s figures. Emphasis on referencing PJM as purely example to demonstrate this.
Degradation Impact: If you ignore the 0.5% degradation, you would overestimate energy by ~6%, leading to an incorrectly low LCOE.
When you see an LCOE, ask yourself these things to see if the model makes sense:
- Is the capacity factor believable?
A solar project claiming 50% in anything but the best Southwest sites with tracking—or wind north of 45% outside the windiest corridors—almost always means the denominator’s been juiced to make LCOE look artificially low.
What discount rate are they using?
Serious sponsor models usually land between 6–8%. Dip much below 6% and you’re almost certainly looking at hidden CapEx optimism or aggressive assumptions. Renewables are so front-loaded that even a 1% hike in the rate can move the needle meaningfully.Are transmission and interconnection costs baked in?
Plenty of headline LCOEs conveniently leave out network upgrades. In places like CAISO or late-cycle PJM queues those can easily tack on $100–400/kW. If they’re missing, the “delivered” LCOE is understated.What degradation rate are they applying and when does it kick in?
For solar, 0.5–1.0% per year is industry standard; zero degradation is wishful thinking and can overstate lifetime output by 6–12% over 25 years. A lot of models also quietly delay the start until year 2 instead of year 1... It’s a small bias, but it adds up.Does it capture end-of-life decommissioning or site restoration?
Nuclear needs hefty provisions (think hundreds of millions per plant). Solar and wind are comparably lighter, but those costs are routinely ignored in published figures, quietly shrinking the numerator.Is working capital accounted for?
Even modest receivables, spares inventory, or other WC build-up usually adds 1–3% to all-in costs. You rarely see it in simplified LCOEs, but it shows up in full sponsor models.All-equity or levered?
Many third-party numbers (Lazard, EIA, etc.) are unlevered. Once you layer in tax equity, back-leverage, or cheaper debt + tax shields, the number can drop 15–30%. Make sure you’re comparing the same capital structure.For solar + storage, are the batteries properly sized and costed?
Four-hour lithium is the default in most headlines, but if you’re trying to deliver anything close to firm power (say 8–12+ hours for data centers or industrial loads), the CapEx jumps sharply. Missing or understated storage makes it incomparable to true baseload.For thermal plants, does heat rate* degrade realistically at lower capacity factors?
Combined cycles burn less efficiently when they’re cycling or backed down. Models that lock in nameplate heat rate across all dispatch scenarios overstate efficiency—and understate fuel costs—in real-world operation.Is this pre-tax or after-tax on OpEx?
Investor-grade models typically tax-effect fixed and variable O&M, which lowers the effective PV of operating costs. Pre-tax versions look worse than they should.
*Quick note on heat rate:
Heat Rate is used for thermal generation assets that burn fuel for energy. This measures how much thermal energy (fuel) is required to generate one net kilowatt-hour (kWh) of electricity. The higher the heat rate, the less efficient the plant. To increase electricity output without building a new plant, utilities perform uprates—modifications to turbines or pumps that improve the plant’s heat rate, allowing it to turn more of that limited thermal energy into salable electricity. Even a small (1%) improvement in heat rate can significantly boost a plant’s bottom line by reducing the amount of waste heat and increasing the total MWh sold.
Some examples of LCOE sensitivities:
Nuclear : The I(t) CapEx is huge, but the E(t) (total energy produced) is massive because the capacity factor is +90%. LCOE is ultra-sensitive to the construction timeline; a 2-year delay destroys the LCOE because interest eats the numerator.
Wind: The numerator is often offset by the Production Tax Credit (PTC), which is a "pay-for-performance" credit. Unlike the Solar ITC (which helps on Day 1), the PTC lowers the LCOE based on how much the wind actually blows.
Gas Generation: The numerator is a slave to F(t) Fuel. If natural gas prices spike, the numerator balloons instantly, while the denominator stays the same.
Useful resources provided by The National Laboratory of the Rockies (NRL):
CREST: Cost of Renewable Energy Spreadsheet Tool
LCOE: Levelized Cost of Energy Calculator
Renewable Energy Supply Curves
Siting, Permitting, and Procurement Analysis
Lazard’s LCOE Analysis
Published July 2025, linked here.
It includes:
Comparative LCOE analysis for various generation technologies on a $/MWh basis, including sensitivities for U.S. federal tax subsidies, fuel prices, carbon pricing and cost of capital
Illustration of how the LCOE of onshore wind, utility-scale solar and hybrid projects compare to the marginal cost of selected conventional generation technologies
Historical LCOE comparison of various technologies
Illustration of the historical LCOE declines for onshore wind and utility-scale solar
Appendix materials, including:
An overview of the methodology utilized to prepare Lazard’s LCOE analysis
A summary of the assumptions utilized in Lazard’s LCOE analysis
Deconstruction of the LCOE for various generation technologies by capital cost, fixed operations and maintenance (“O&M”) expense, variable O&M expense and fuel cost
LCOE Comparison between Renewable and Conventional Generation:
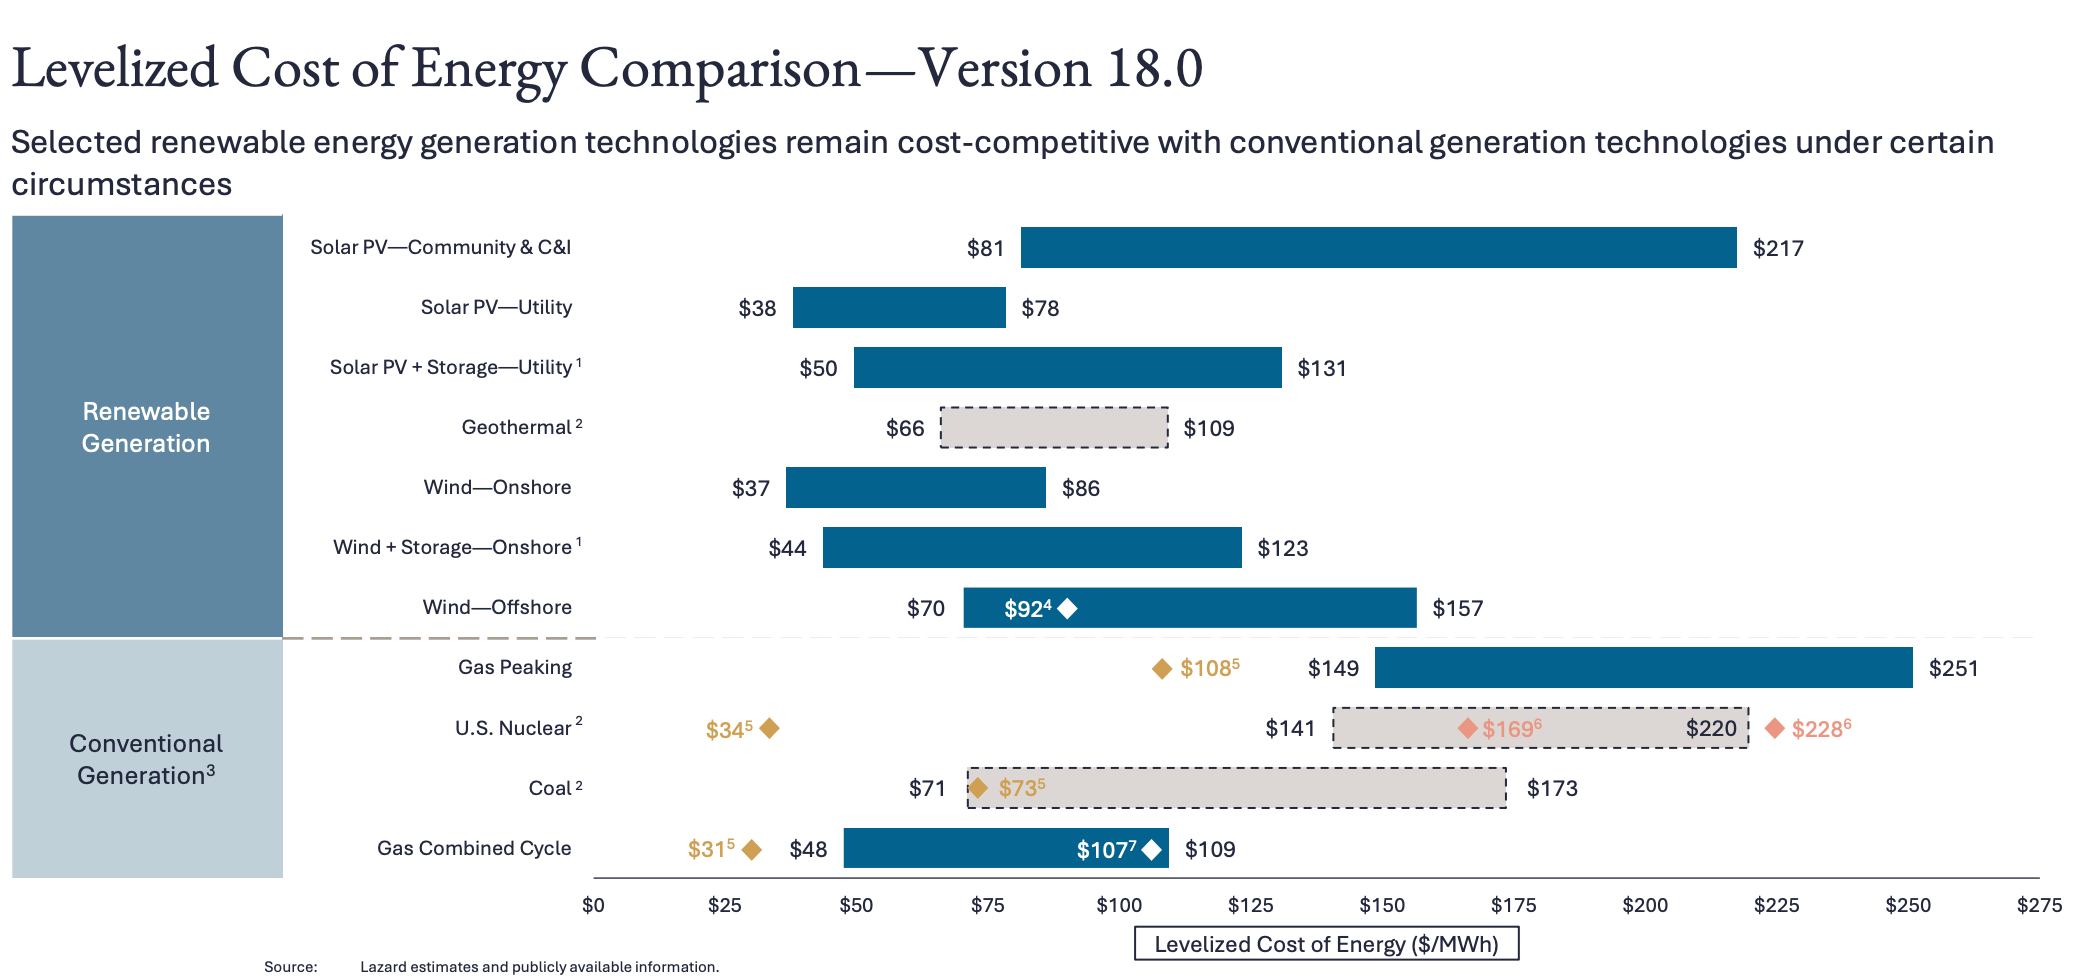
- Reflects the LCOE for a system composed of standalone generation plus standalone storage less the combined system-level synergies (assumed to be 10% of storage capital costs and 25% of inverter costs). The synergies capture potential cost reductions or efficiency gains from integrating generation and storage, such as shared interconnection infrastructure, improved energy dispatch, enhanced capacity utilization and operational efficiencies.
Given the limited public and/or observable data available for new-build geothermal, coal and nuclear projects, the LCOE presented herein reflects Lazard’s LCOE v14.0 results adjusted for inflation and, for nuclear, are based on the estimated costs of the Vogtle Plant. Coal LCOE does not include cost of transportation and storage.
The fuel cost assumptions for Lazard’s LCOE analysis of gas-fired generation, coal-fired generation and nuclear generation resources are $3.45/MMBTU, $1.47/MMBTU and $0.85/MMBTU, respectively, for year-over-year comparison purposes. See page titled “Levelized Cost of Energy Comparison—Sensitivity to Fuel Prices” for fuel price sensitivities.
Represents the illustrative midpoint LCOE for Dominion’s Coastal Virginia Offshore Wind (“CVOW”) project, based on the publicly disclosed capital cost of ~$8.7 billion (excluding onshore transmission costs) and offshore wind estimates from Lazard. Dominion’s projected LCOE for CVOW as of February 2025 is $91/MWh in 2027 dollars, with an expected COD in 4Q 2026.
Reflects the average of the high and low LCOE marginal cost of operating fully depreciated gas peaking, gas combined cycle, coal and nuclear facilities, inclusive of decommissioning costs for nuclear facilities. Analysis assumes that the salvage value for a decommissioned gas or coal asset is equivalent to its decommissioning and site restoration costs. Inputs are derived from a benchmark of operating gas, coal and nuclear assets across the U.S. Capacity factors, fuel, variable and fixed operating expenses are based on upper- and lower-quartile estimates derived from Lazard’s research. See page titled “Levelized Cost of Energy Comparison—New Build Renewable Generation vs. Marginal Cost of Conventional Generation” for additional details.
Represents illustrative LCOE values for Vogtle nuclear plant’s units 3 and 4. The analysis is based on publicly available estimates and suggestions from selected industry experts, indicating a cost “learning curve” of ~30% between Vogtle units 3 and 4. Analysis assumes total operating capacity of ~2.2 GW, total capital cost of ~$32.3 billion, capacity factor of ~97%, operating life of 70 years and other operating parameters estimated by Lazard’s LCOE v14.0 results, adjusted for inflation.
Illustrative high case reflects elevated capital costs ($2,400/kW – $2,600/kW) based on recently observed market quotes for CCGT projects in early stages of development (post-2028 COD)
LCOE Sensitivities to US Federal Tax Subsidies:
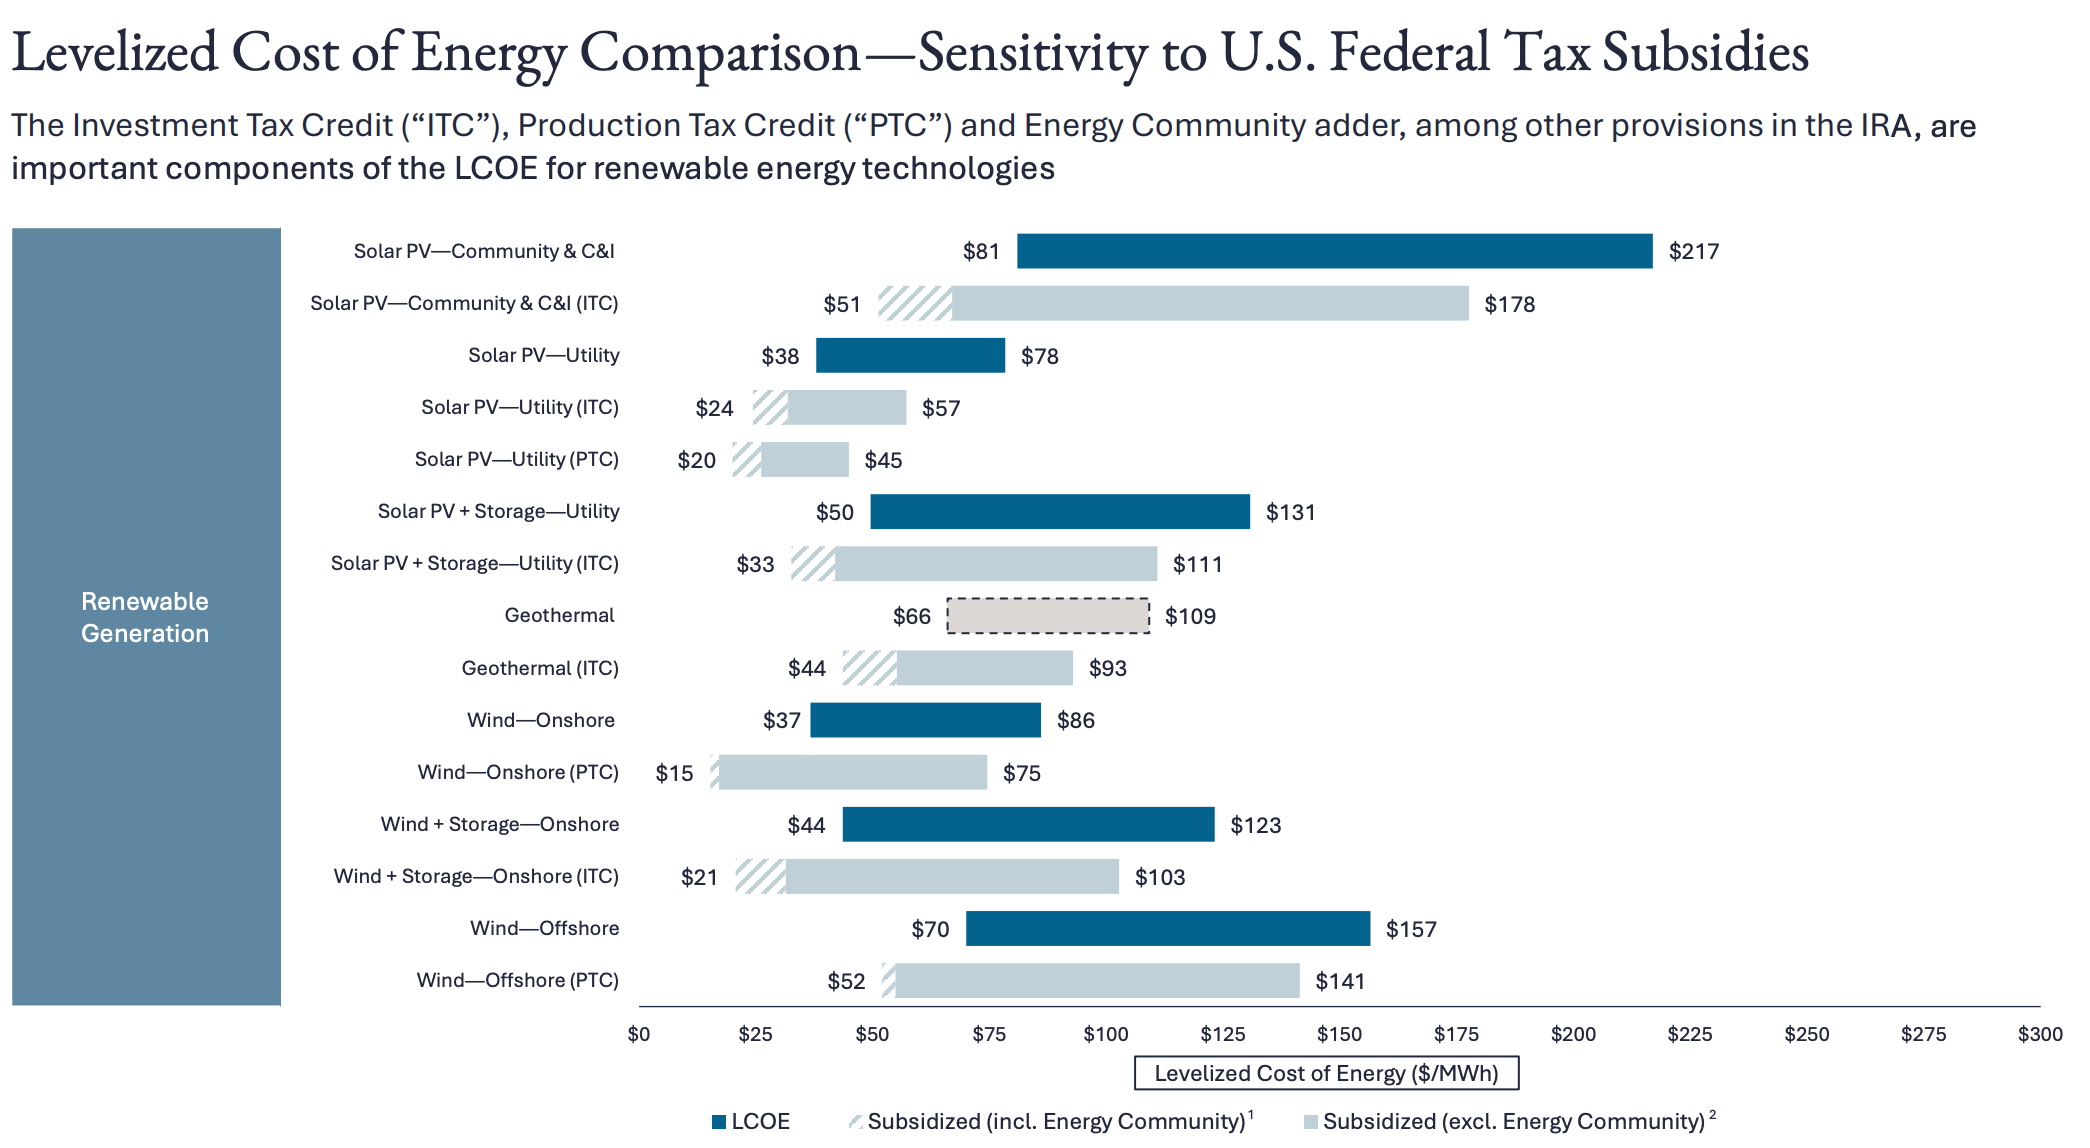
Unless otherwise indicated, this analysis does not include other state or federal subsidies (e.g., domestic content adder, etc.). The IRA is a comprehensive and evolving piece of legislation that is still being implemented and remains subject to interpretation—important elements of the IRA are not included in our analysis and could impact outcomes. Lazard’s LCOE analysis assumes, for year-over-year reference purposes, 60% debt at an 8% interest rate and 40% equity at a 12% cost (together implying an after-tax IRR/WACC of 7.7%).
This sensitivity analysis assumes that projects qualify for the full ITC/PTC, have a capital structure that includes sponsor equity, debt and tax equity and assumes the equity owner has taxable income to monetize the tax credits and also includes an Energy Community adder of 10% for ITC projects and $3/MWh for PTC projects.
This sensitivity analysis assumes that projects qualify for the full ITC/PTC, have a capital structure that includes sponsor equity, debt and tax equity and assumes the equity owner has taxable income to monetize the tax credits.
LCOE Sensitivities to Fuel Pricing:
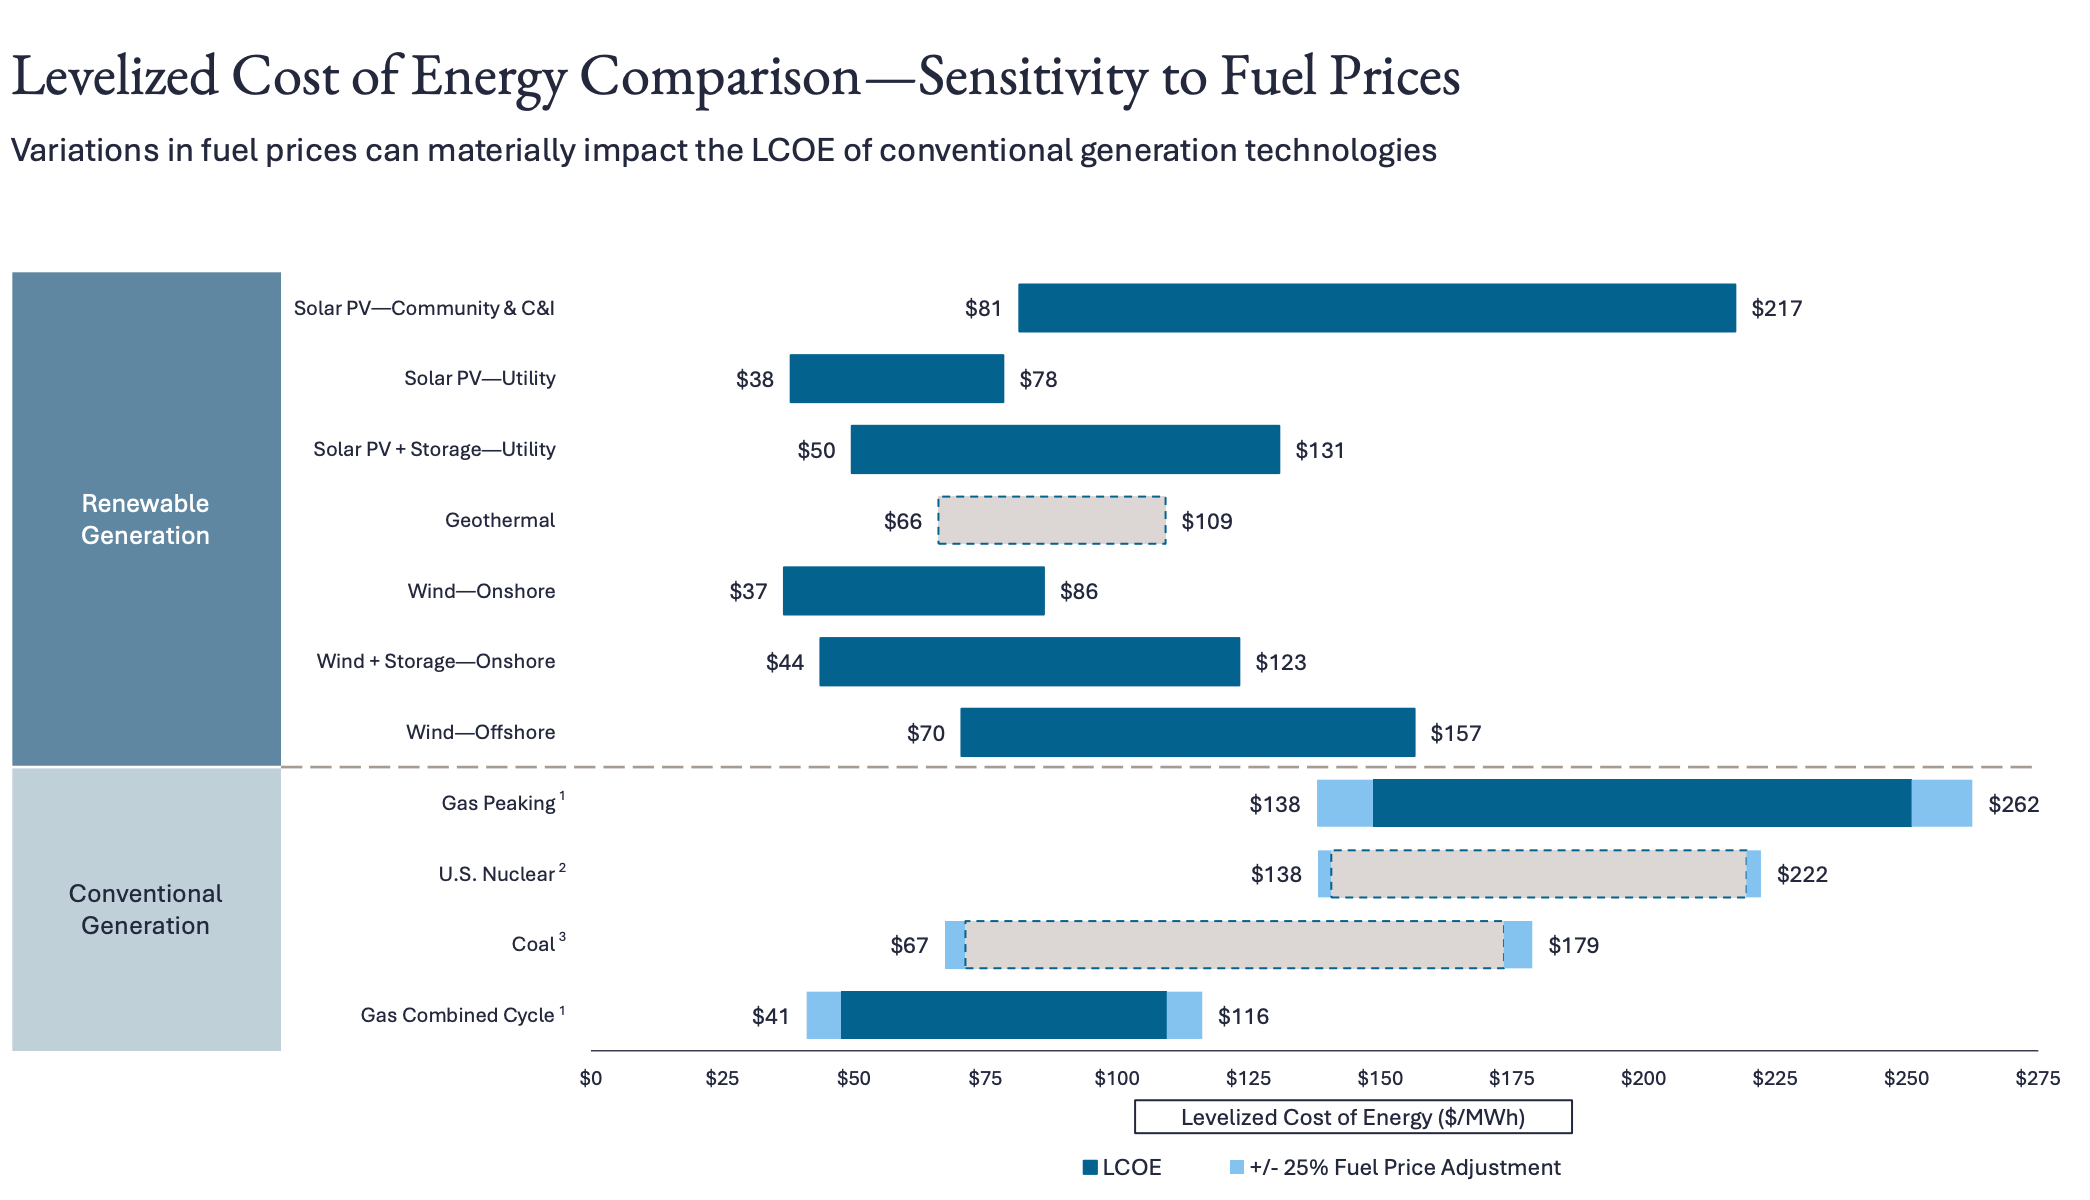
Assumes a fuel cost range for gas-fired generation resources of $2.59/MMBTU – $4.31/MMBTU (representing a sensitivity range of ± 25% of the $3.45/MMBTU used in the LCOE).
Assumes a fuel cost range for nuclear generation resources of $0.64/MMBTU – $1.06/MMBTU (representing a sensitivity range of ± 25% of the $0.85/MMBTU used in the LCOE).
Assumes a fuel cost range for coal-fired generation resources of $1.10/MMBTU – $1.84/MMBTU (representing a sensitivity range of ± 25% of the $1.47/MMBTU used in the LCOE).
LCOE Sensitivities to Cost of Capital:
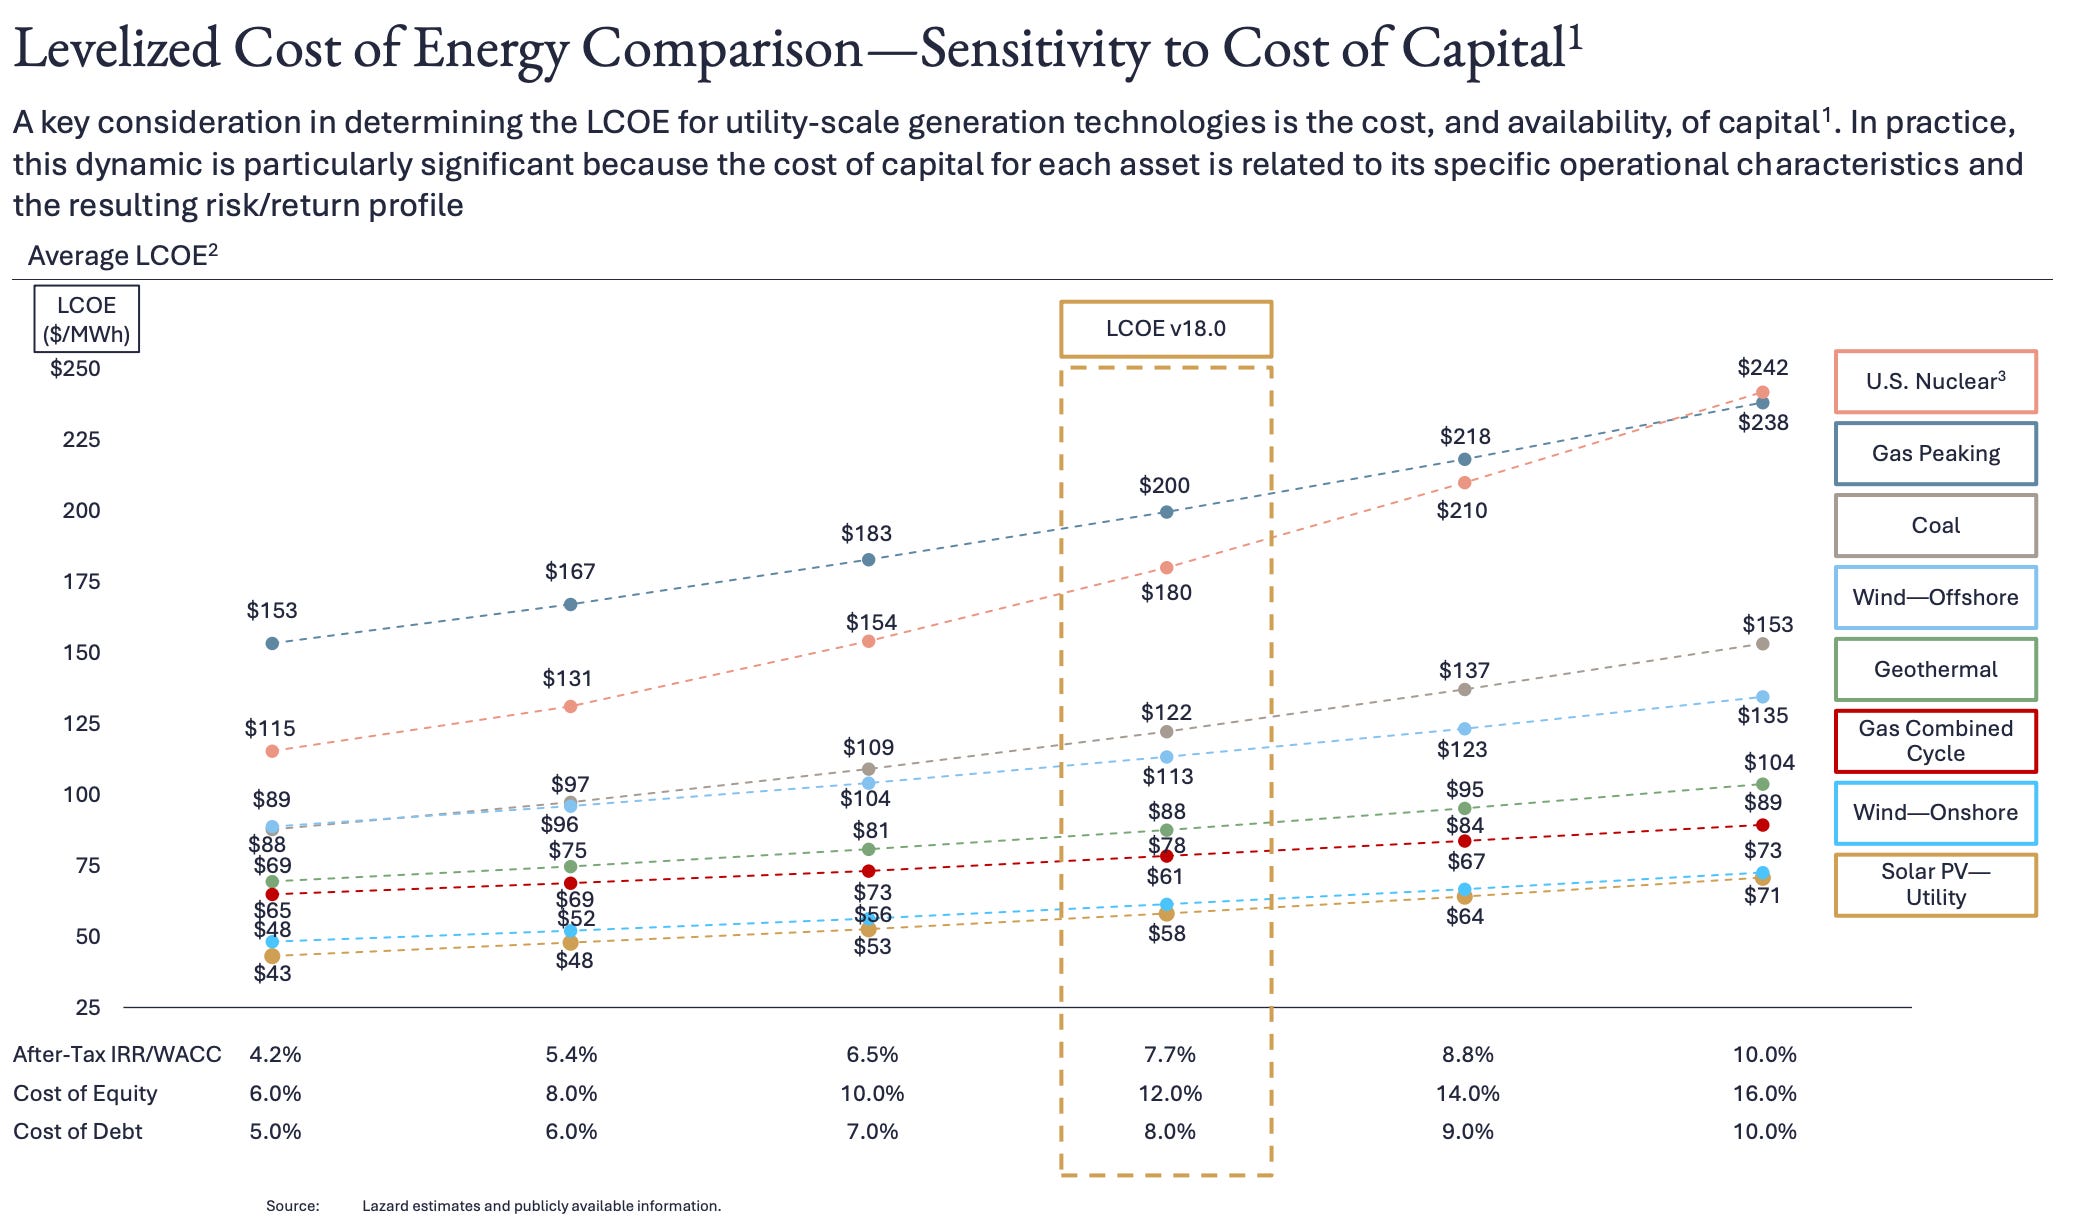
Analysis assumes 60% debt and 40% equity.
Cost of capital as used herein indicates the cost of capital applicable to the asset/plant and not the cost of capital of a particular investor/owner.
Reflects the average of the high and low LCOE for each respective cost of capital assumption.
Given the limited public and/or observable data available for new-build nuclear projects, the LCOE presented herein reflects Lazard’s LCOE v14.0 results adjusted for inflation and are based on then-estimated costs of the Vogtle Plant
New Build Renewable Generation Vs. Marginal Cost of Conventional Generation:
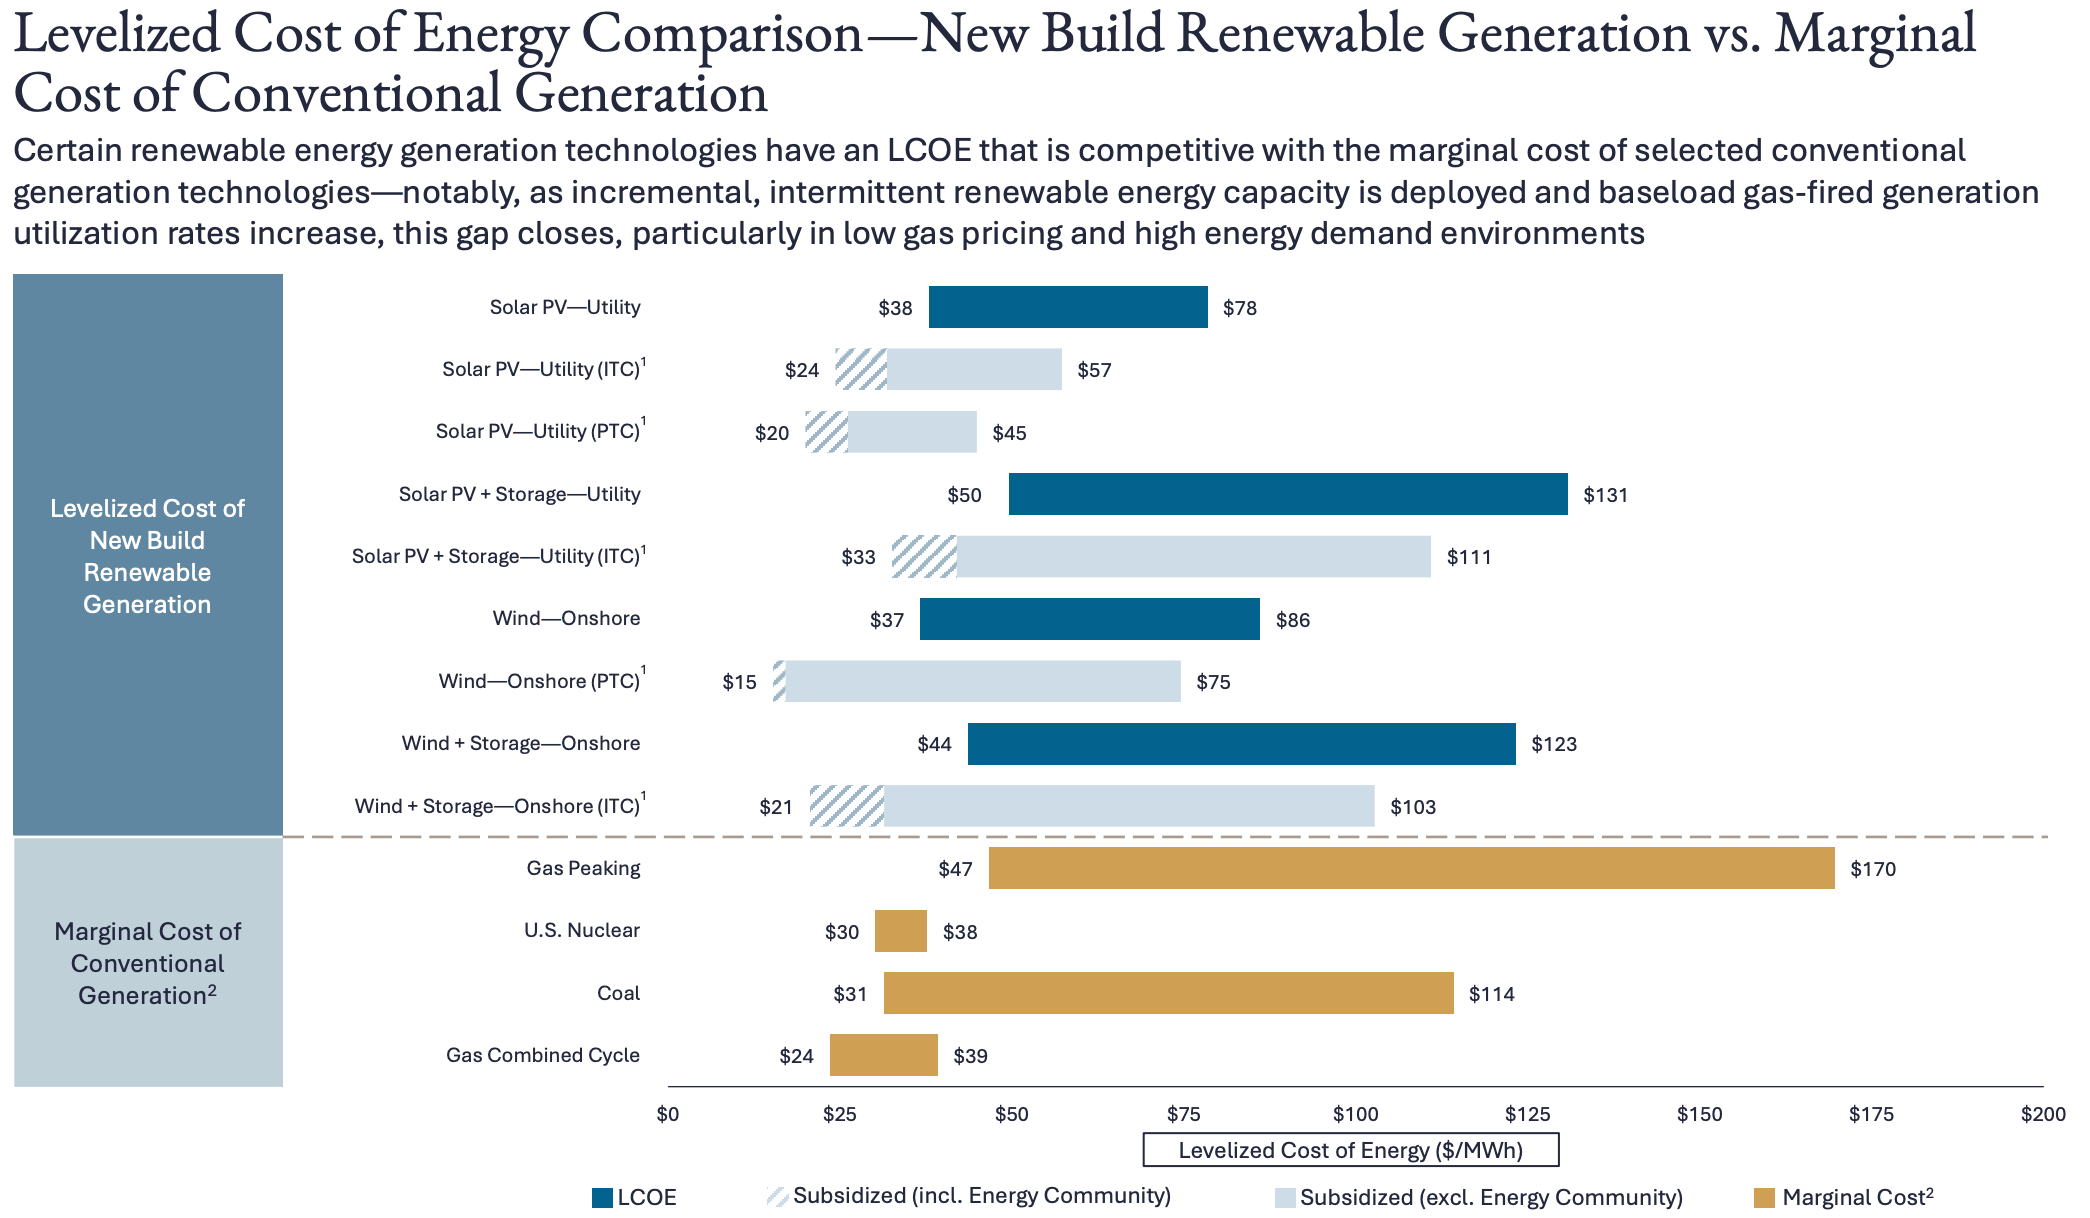
1. See page titled “Levelized Cost of Energy Comparison—Sensitivity to U.S. Federal Tax Subsidies” for additional details.
2. Reflects the marginal cost of operating fully depreciated gas, coal and nuclear facilities, inclusive of decommissioning costs for nuclear facilities. Analysis assumes that the salvage value for a decommissioned gas or coal asset is equivalent to its decommissioning and site restoration costs. Inputs are derived from a benchmark of operating gas, coal and nuclear assets across the U.S. Capacity factors, fuel, variable and fixed O&M are based on upper- and lowerquartile estimates derived from Lazard’s research.
Historical LCOE Comparison Across Generation Types: