
What’s The Real Driver Behind Bull And Bear Markets?
(Written by Bert Dohmen & Dion Dohmen, contains excerpts from our latest April 30, 2026 Wellington Letter)
Bull and Bear markets are NOT A FUNCTION of earnings, contrary to popular theory. They are a function of human emotions.
That is why sometimes P/E ratios of the indices at 25 are considered investible, and many glamour stocks with no earnings or P/E ratios of 300-400 are recommended as buys (ex. PLTR), while at bear market bottoms the P/E’s of many stocks go to single digits and investors are still reluctant to buy them.
The vast majority of people and analysts don’t consider this. The excessive margin buying of stocks, and scooping up of worthless SPACS and CRYPTOS, has also been fading. Rational thinking will eventually replace blind enthusiasm, but that will be at the bottom of the bear market.
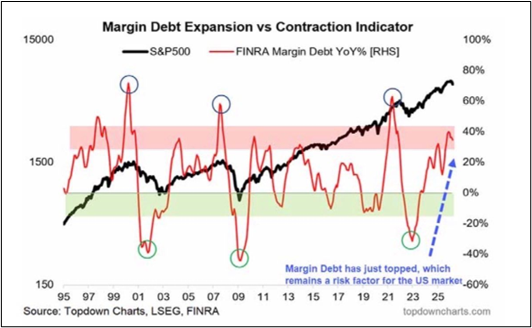
Additionally, margin buying in investment margin accounts this year have started declining. The high was 10 months ago. According to FINRA statistics, U.S. margin debt stood at $1.253 trillion in February 2026, down 2.0% (or about $26 billion) from January 2026.
Here’s a good chart we recently saw that clearly depicts the decline in Margin Debt Expansion (red line) over the past two months. Notice how it last peaked in 2021 at the top of the bull market at that time, then fell into 2023 during the bear market. That then led to a bottom in 2023 and a renewed rise into 2026.
However, after declining in February (first monthly decline in 10 months) and again in March, it now appears to be making a secondary top. That normally coincides with the end of the bull market. It marks the “exhaustion” point for the bulls.
As you can see on the chart, this secondary top is similar to what occurred in 2004 and 2010, both of which came after historic peaks (i.e., 2000 and 2007).
Therefore, this is at minimum a warning signal that excess debt (i.e., “leverage”) is being reduced by investors, which means speculation is shrinking.
If there is a big market plunge in the coming weeks or months, this unwind would cause a huge deleveraging as margin calls force investors to sell, which causes a selling avalanche.
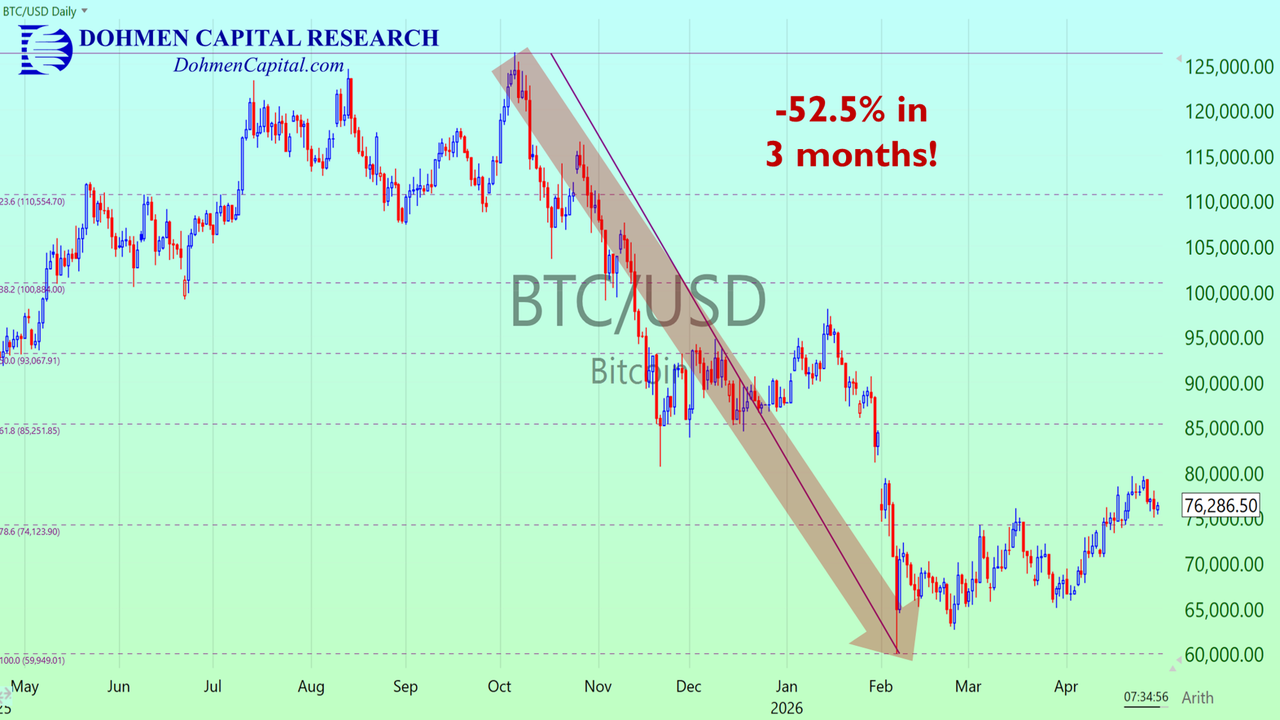
Another great measure for bullish or bearish enthusiasm (emotions) in our opinion is the performance of Bitcoin. It has no intrinsic value, no earnings, no measures of value except its price in the market. The “price” is not a measure of value. Instead, it is a measure of emotions.
Therefore, “emotions” are the only driving factor and thus a great measure of sentiment. Bitcoin lost over 50% of its “value” from the October peak last year to the February 2026 low. The only thing that changed was speculative emotions.
This measure is long term and has nothing to do with short term moves. It only controls the longer trends.
These are just some of our tools for detecting bear markets. Financial TV doesn’t tell you that.
You can read more about our current analysis, forecasts, and how we examine the markets in our latest research report, available FREE for a limited time to ZeroHedge readers.
In this 18-page report, we explain what could be “The Trigger For The Next Global Financial Crisis.” We also reveal how smart investors can protect their hard-earned wealth and profit when most others panic.
Get your copy today at DohmenCapital.com/SpecialReport2026
Wishing you successful investing,
Bert Dohmen, Founder
Dion Dohmen, Vice President
Dohmen Capital Research