
Gold Could 2-4x in 18 Months: The 1970s Inflation Parallel
A striking correlation between today’s US CPI trajectory and the 1970s inflation cycle points to a second, larger wave ahead. Gold peaked five months before CPI in 1980. If history rhymes, maximum velocity in this gold bull market is still in front of us.
We lay out the framework, the numbers, and what it means for our positioning.
A 1970s CPI Parallel Suggests Gold’s Strongest Phase May Still Lie Ahead
A striking chart by Kobeissi Letter shows the evolution of CPI inflation in the US from 2015 until today and overlays it against its evolution from 1967 until 1978.
US CPI YoY: 2015–Present vs 1967–1983 overlay
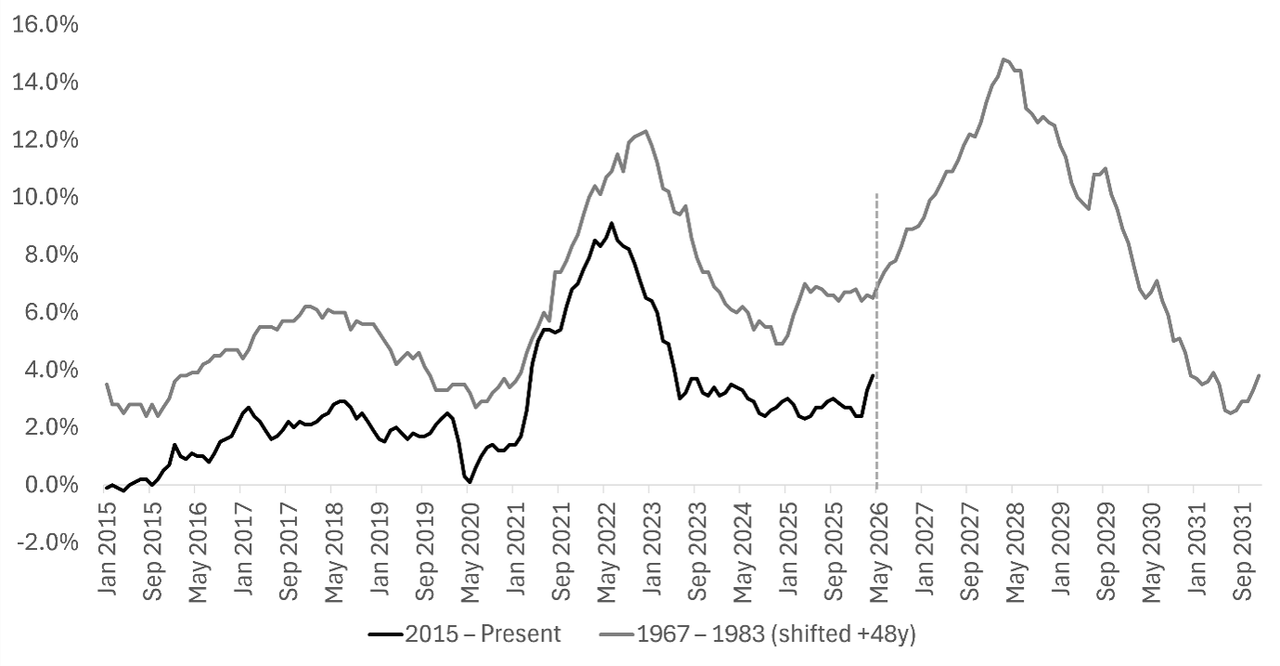
Source: Adapted from Kobeissi Letter, BLS
The relationship between both periods is striking, and something we had overlooked. We have estimated the R2 at 75%.
Regression 1967-1978 US CPI inflation vs CPI 2015-present, monthly (Log-log )
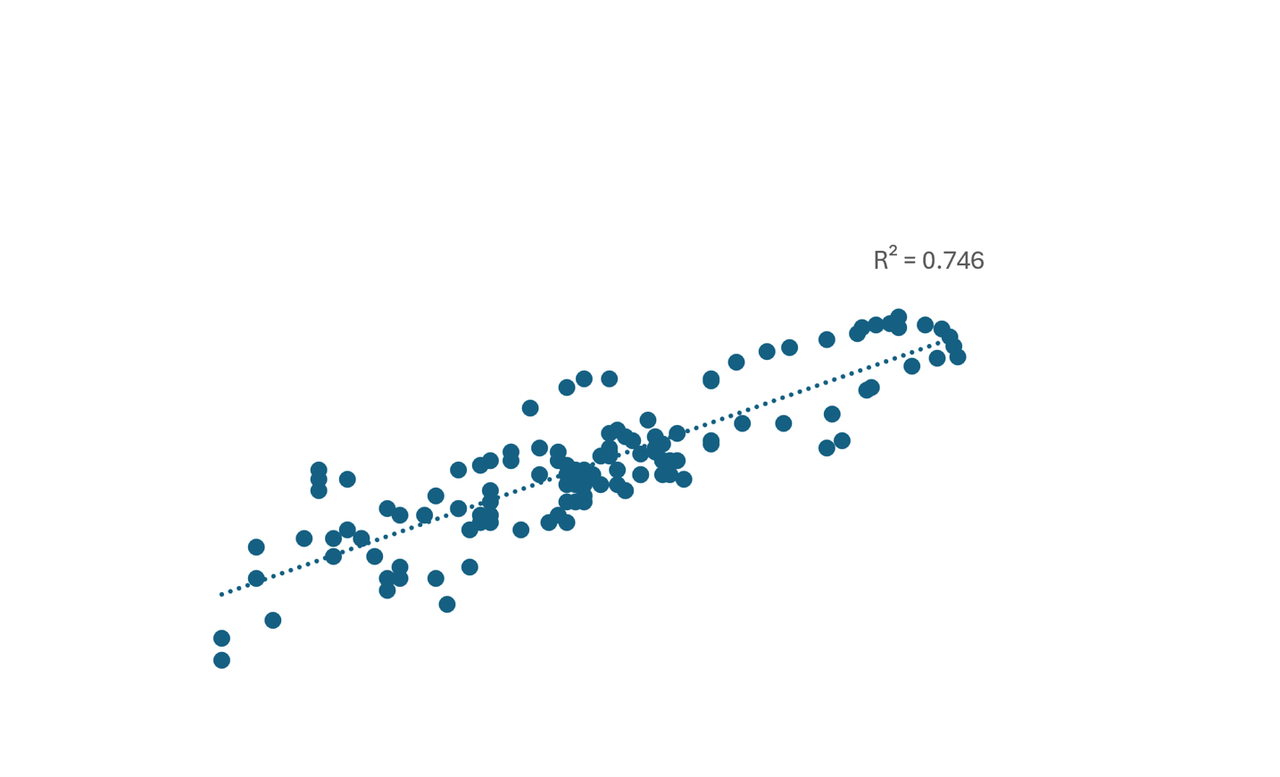
Source: Asymmetric Research, BLS
We had believed for some time that inflation was going to re-accelerate, and our base case was that we were likely in the early stages of a 1970s analogy, one reinforced by the Iran conflict, which struck us as a clear parallel to the 1973 oil embargo. But what if that’s the wrong starting point? What if, having already lived through the first big inflation wave four to five years ago, we are now effectively in June 1978: staring at an even larger inflation surge ahead of us.
We have run a model to estimate where CPI could be heading now, assuming this historical relationship holds, again, assuming we are indeed at the same point as June 1978. The model points to CPI gradually rising over the next two years to 12% surpassing our 2022 peak of 9%.
The gold price peaked in January 1980, around five months before CPI peaked. Between May 1978 and January 1980 gold rose by 3.5x to $670/oz, with c85% of the move up happening from April 1979. A mirror image of the performance would mean gold rising c25% by year end 2026 to c$5,500/oz, before nearly tripling April 2027-January 2028.
US CPI Inflation and forecasts (%) if historical correlation continues to hold, and historical gold price nominal ($/oz)
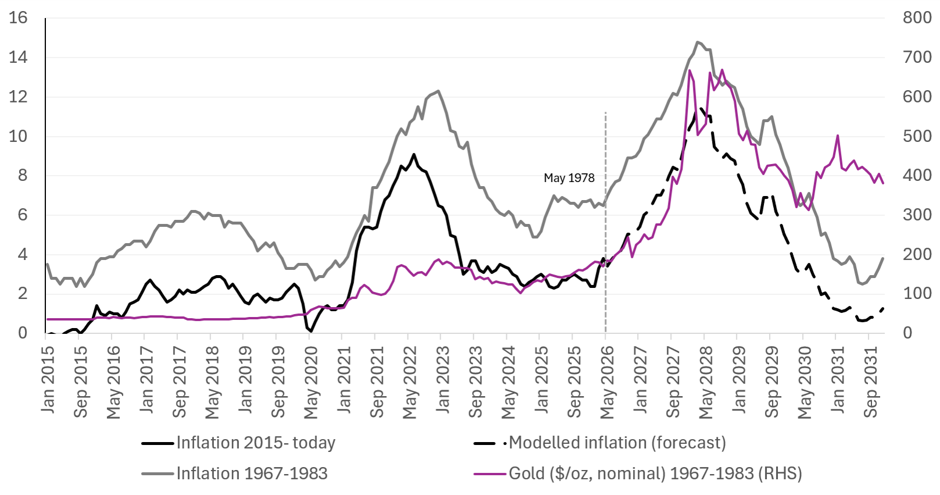
Source: Asymmetric Research, BLS, Macrotrends
Could we see a repeat of this gold price performance, reaching c$16,000/oz in January 2028? The magnitude would not be inconsistent with mining legend Pierre Lassonde’s $17,250/oz target within the next three years, off by around a year in timing. Rick Rule has hinted at a triple in the gold price within 10 years (implying c$15,000/oz). From past observations, he tends to be extremely conservative with his catalyst timelines.
In a more conservative alternative scenario, adjusting for the positive one-off effect of the end of the gold standard in 1971, we think gold has potential to double from here, reaching $9,000/oz by January 2028. This further adjusts for the fact that gold materially outperformed in the period June 2021 to today versus June 1973 to June 1978 (2.5x vs +50%). Under this scenario, we could see stability in the gold price at current levels before a rapid doubling from summer 2027.
Nominal gold prices rebased (100) and implicit gold price upsides by 1 January 2028 if US inflation historical correlation continues to hold
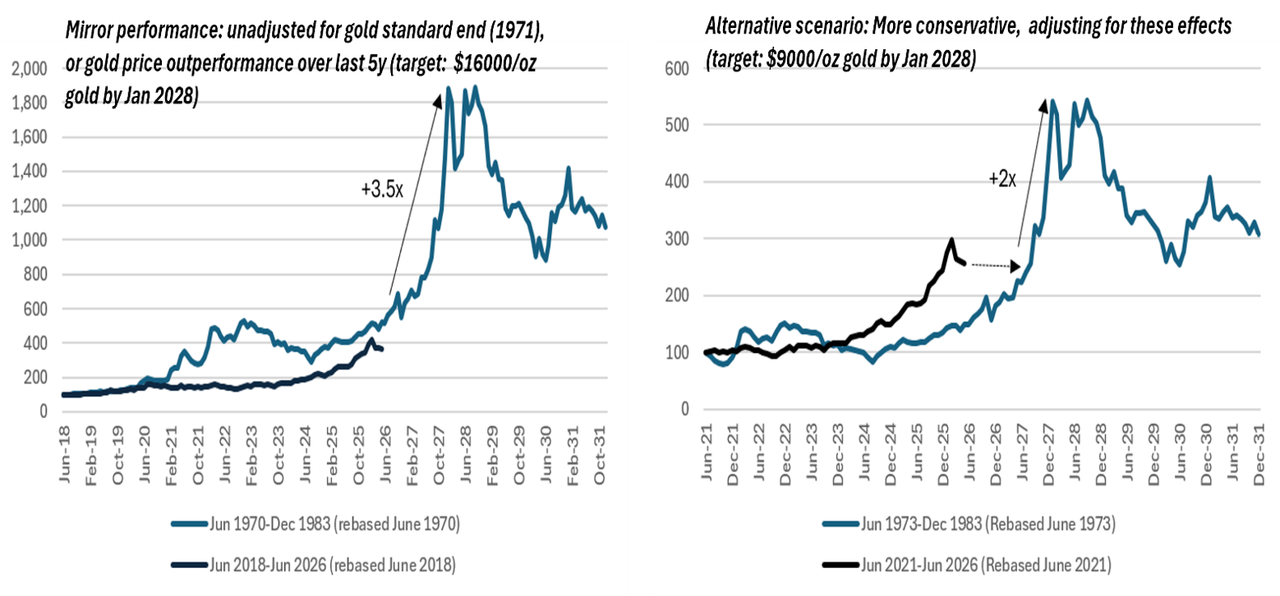
Source: Asymmetric Research, BLS, Macrotrends
In either case, this model suggests we are approximately one year away from the next major leg up in gold. Under the first scenario, some meaningful performance is expected through 2026 before a more dramatic move in early 2027; under the second, stability at current levels before surging from summer 2027.
A Clear Asymmetry
Gold presents around 10% downside against 2-3.5x upside, in our view. The asymmetry is clear.
Gold is down 20% from late January peak. This is already equivalent to the 30-year median peak-to -trough level of correction.
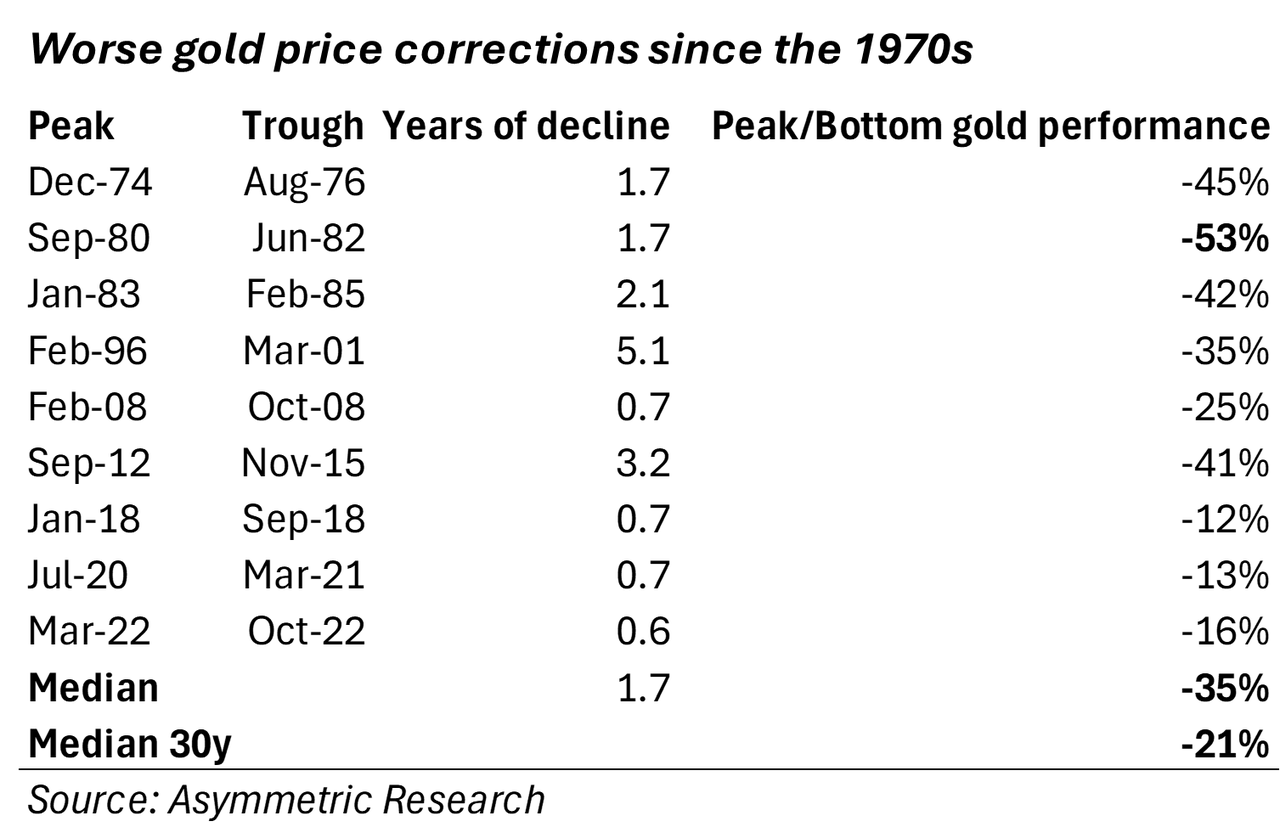
A realistic downside from here looks limited to c10% to c$4050/oz, equivalent to a peak-to-trough fall from the January peak of 28%, which would place it worse than the 2008 financial crisis fall.
Realistic gold price downside

Source: Asymmetric Research
We must stress once again that the gold bull runs ended in 1975-76 and post-1983, amid post-recession periods of perceived Fed success on inflation plus above-trend GDP (>5% in 1976, >4% average 1983–1993). We are currently facing the exact opposite: accelerating inflation and growth headwinds.
Rising nominal rates were highly bullish for gold in the 1970s, a dynamic that could repeat today.
The system’s ability to withstand higher interest rates is also much more constrained today than it was then. Federal debt as a percentage of GDP is 3-4 times higher, and the budget deficit as a share of GDP is larger, despite nominal rates in the 1970s being much higher. This bull cycle may prove even superior to that of the 1970s.
Gold price nominal and recessions, historically (USD/oz)
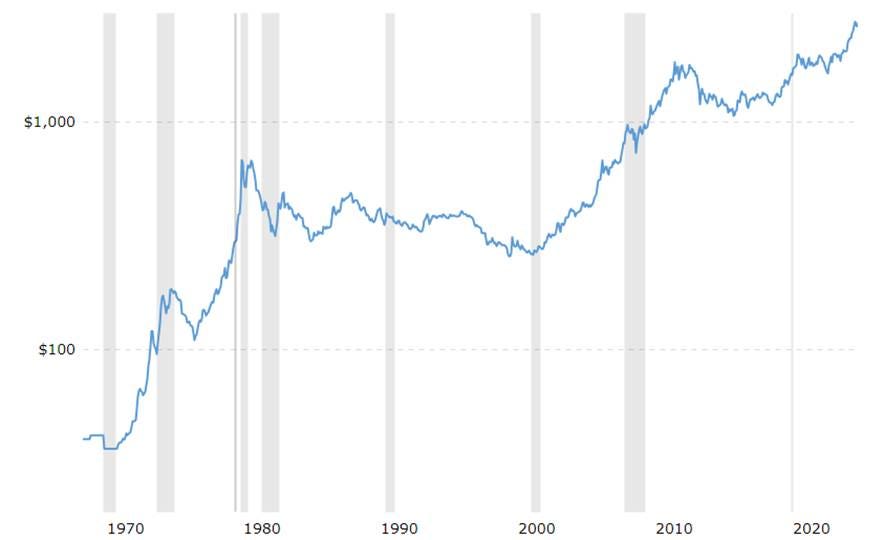
Source: Macrotrends. *Shaded areas are periods of recession
FED Funds rate, historically
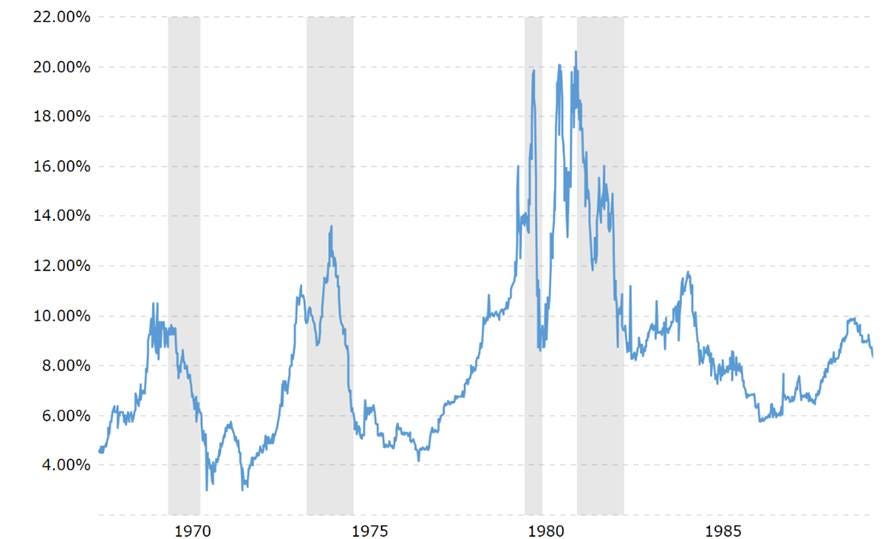
Source: Macrotrends
Gold Equities – Rerate to Closely Track Gold. Discounting Conservative c$4,000/oz
A repeat of the 1970s would put gold equities within 18 months of a major re-rating, effectively following gold with virtually no lag. Gold miners rose 7x between 1973 and 1980, despite oil prices rising 10x over the same period. The gold miners index rose 3.5x between 1978 and 1980, broadly in line with gold at first glance, but this masks the fact that oil was up a sustained 2.5x over the period, significantly compressing margins.
Furthermore, gold miners traded then at higher multiples than they do today. Assuming they correctly factored in prevailing gold prices at the time, the index was likely trading at around 1.7x NAV we estimate, meaning there is additional upside scope today, from multiple expansion.
Barron’s Gold Mining Index

Source: Sprott for Index, Asymmetric Research (star and dashing)
We estimate the equities are today discounting $4,000/oz gold. In other words, they already discount the reasonable gold price correction scenario we defined above.
At a $9,000/oz gold price in 2028, and at 1x EV/NPV…
[...]
This article was originally published on Asymmetric Research. Continue reading the full analysis including our gold equities upside calculations and highest-conviction positions at: asymmetricresearch.substack.com