
Market Bounce Incoming
Welcome to MktContext! I am a professional money manager, trader, and investor who has been timing and beating the market for over a decade. We specialize in predicting market direction by studying the economy and market signals. Join 12,000 subscribers at MktContext.com for our weekly deep dives and analysis!
Markets rallied sharply on Trump’s announcement of a forthcoming deal with Iran. Oil prices have already been in a steady downtrend of late, barely reacting to confrontation. This week’s news sent oil straight down.
And yet the consensus of Wall Street analysts remains the same: Oil to $200, unchecked inflation, possible global recession.
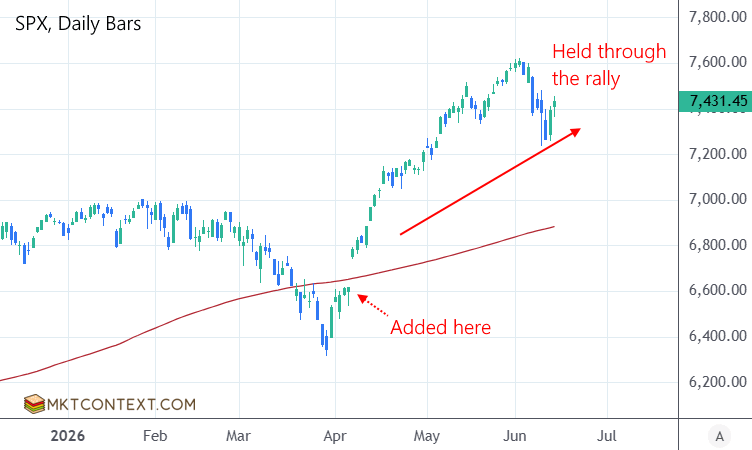
Readers of MktContext know that we have been bullish on the Iran deal, bearish on inflation, and bullish on the economy. By understanding this context, we were able to buy SPX near the lows in early April. We’ve been riding the bull ever since. We are still holding and expecting new highs.
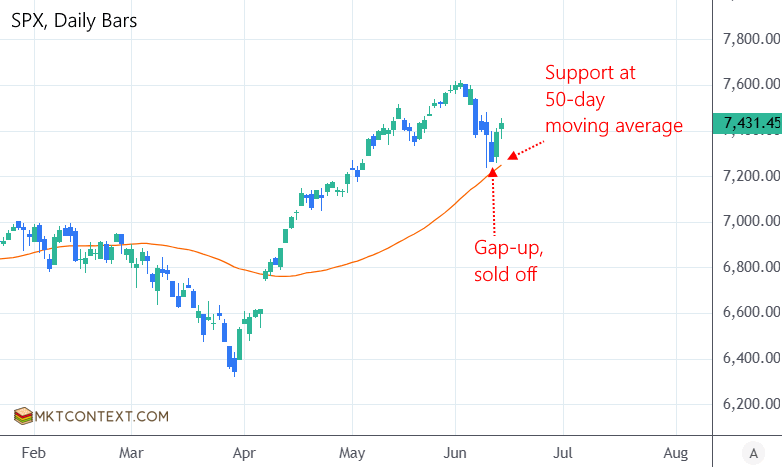
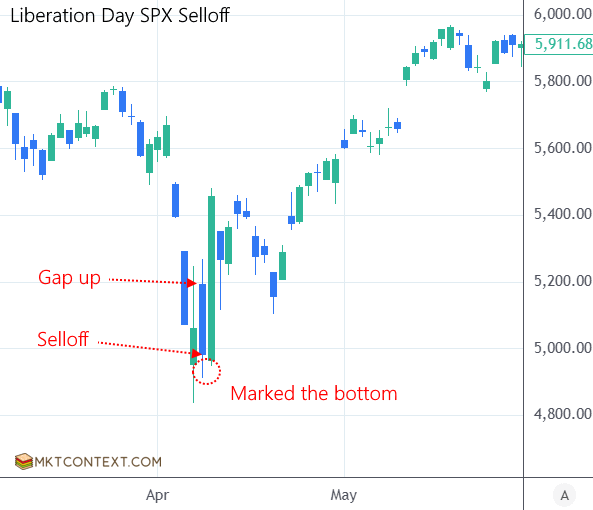
SPX found support and bounced off the 50-day moving average perfectly. The intraday candlestick pattern also indicates a bottom has been formed: On Weds, SPX gapped up and sold off. This has been a common bottoming pattern found at the Mar 30, 2026 bottom (Iran war) and Apr 8, 2025 bottom (tariff war).
We have been curious why our favorite Skew indicator, which often identifies tops in the market, failed to pick up the most recent peak. We think it was because call options were overpriced (due to euphoric buying behavior) which suppressed Skew.
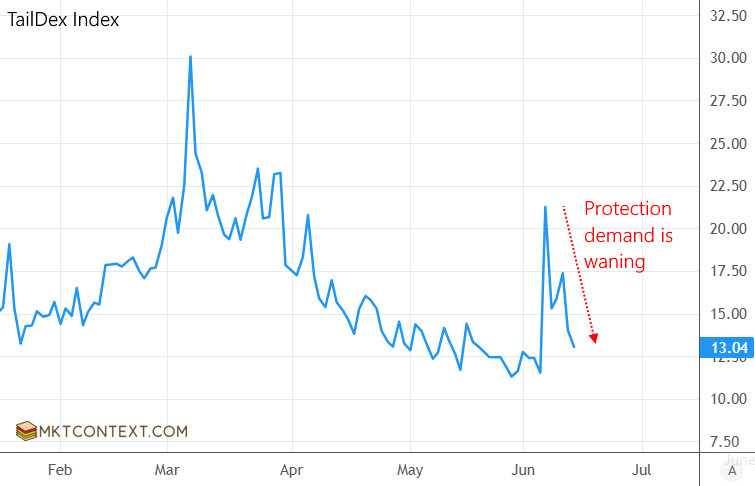
Looking at SkewDex and TailDex, which only consider put option skew, the price of downside protection spiked on the first big selloff day. Thereafter, demand for protection has waned, which indicates the pullback may be done.
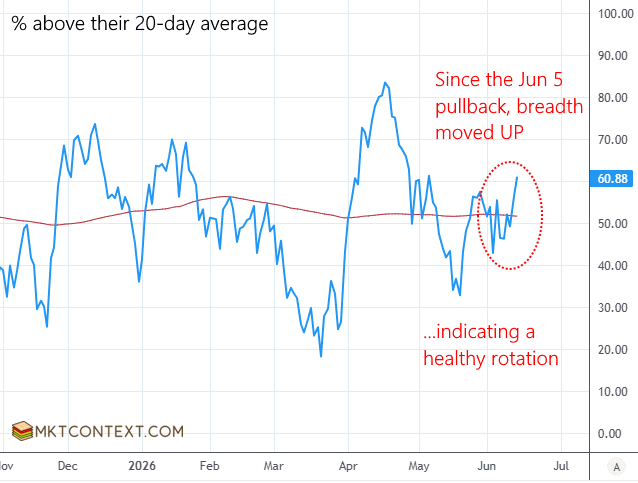
Yet the most important piece of information was found in breadth. As shown below, since the Jun 5 pullback, breadth actually improved meaning more stocks are going up. What’s happened is money escaped concentrated areas like tech/semis, and spread out into other parts of the market. Hence we started seeing restaurant stocks, retail stores, and healthcare stocks rebound. That’s a great sign of investors rotating as opposed to exiting (going to cash).
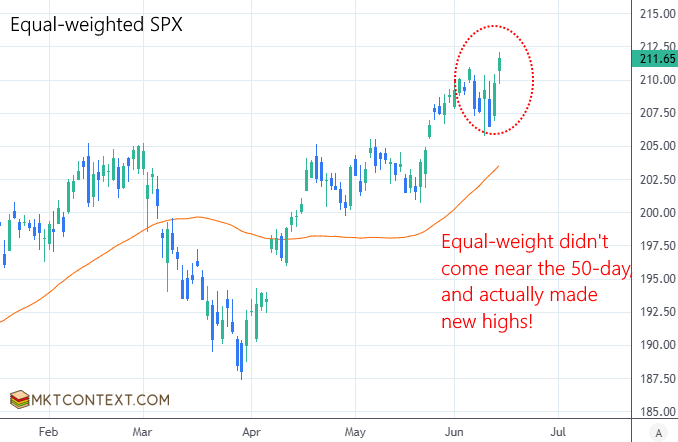
Look at how the equal-weighted SPX (which reduces concentration of the mega-cap tech stocks) never touched the 50-day average, and actually made new highs in the last few days! So while tech stocks might lag a bit, this signal is incredibly bullish for the broader stock market as a whole.
Read the rest of this article at MktContext.com
Join 12,000+ macro investors who get these insights before the mainstream media catches on!
Contributor posts published on Zero Hedge do not necessarily represent the views and opinions of Zero Hedge, and are not selected, edited or screened by Zero Hedge editors.