




Technical Signals Turned Bearish
Welcome to MktContext! I am a professional money manager, trader, and investor who has been timing and beating the market for over a decade. We specialize in predicting market direction by studying the economy and market signals. Join 13,000 subscribers at MktContext.com for our weekly deep dives and analysis!
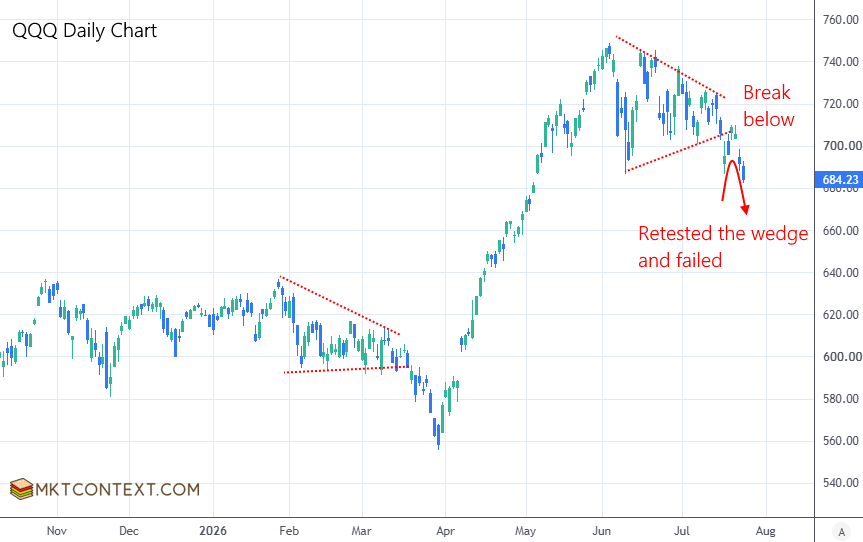
The SPX and Nasdaq continued their topping pattern, reminiscent of early 2026. SPX failed its July 6 trend breakout. The indexes gapped down sharply on Thurs without filling the gap, marking a second consecutive week of price rejection.
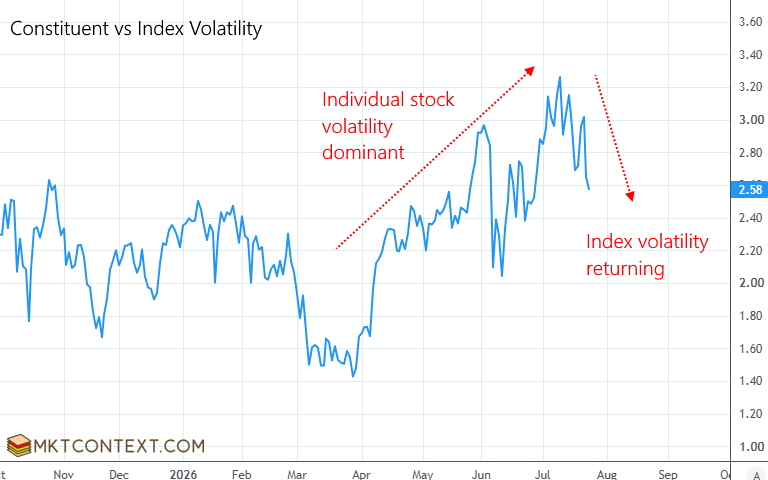
Volatility is the bigger tell. Previously, individual stocks were volatile but index-level volatility remained calm (chart below). SPX largely ignored tech weakness until this week, when it finally took a hit and closed under its 50-day moving average. The regime is shifting, and volatility is now being reflected across the broader index.
We have previously highlighted the high dispersion in the index, which meant rotation was happening under the hood. Individual stocks were moving in different directions; some up, some down. Now, dispersion is falling as everything falls together.
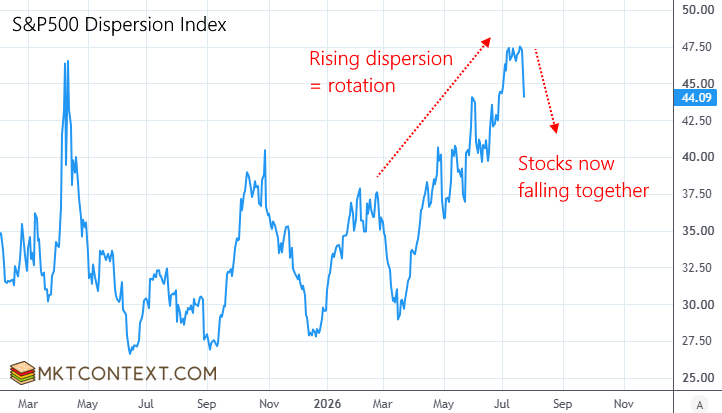
Crucially, the unwinding of the dispersion trade will itself drive higher volatility at the index level.
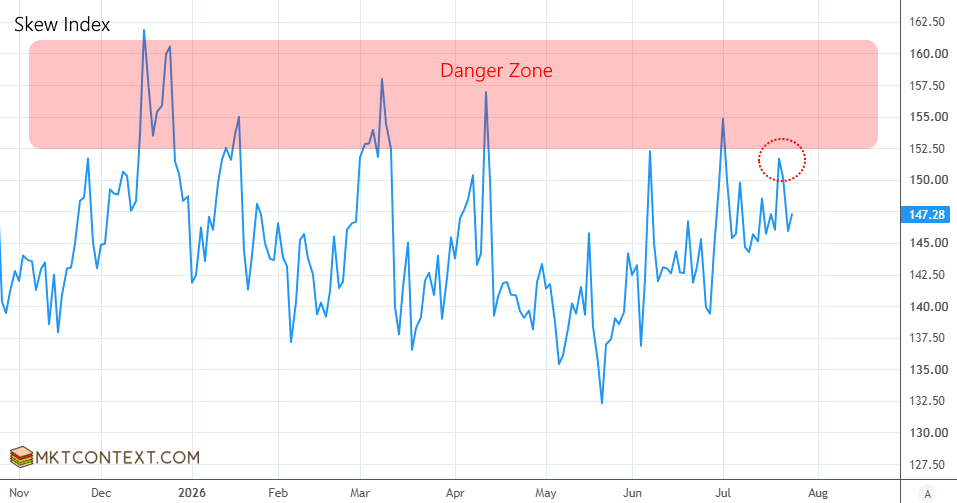
Our favorite indicator of market peaks, Skew Index, reached the danger zone. This indicator triggers when institutions start hedging portfolios with put options, thus creating selling pressure. It portends more selling ahead.
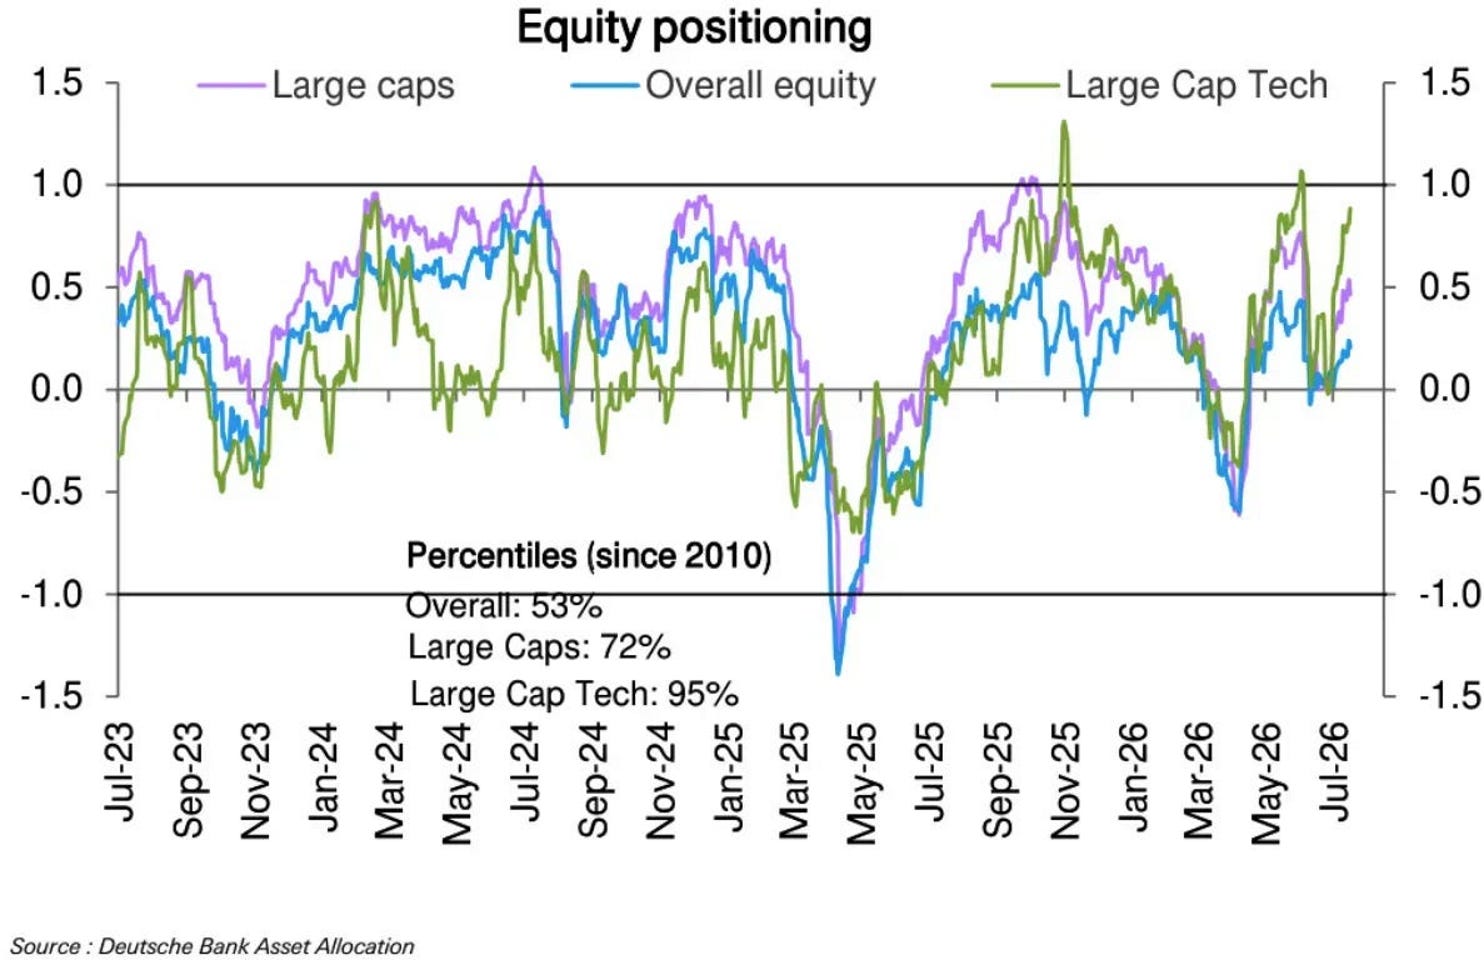
Tech positioning is still surprisingly high, given the issues of late. We think investors are too concerned about underperforming the index, and thus are overlooking the risks. Overall equity positioning is a bit more moderate.
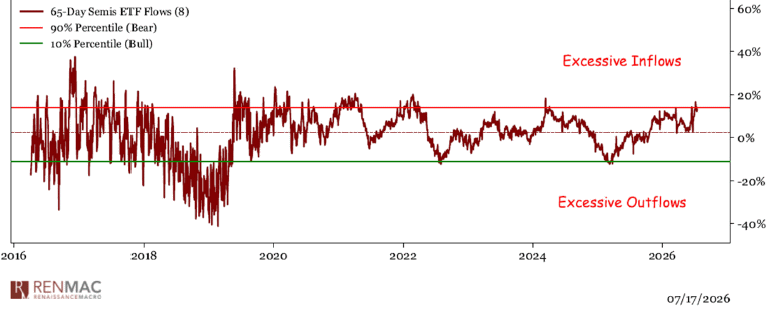
 Despite a -20% selloff in chip stocks, positioning remains relatively high. The chart below shows fund inflows for the SMH ETF are still excessive. Investors attempted to buy the oversold dip, however we think the selloff isn’t done yet. As mentioned last week, we need to see at least a visit to the 100-day moving average. As the saying goes, bottoms are built on fear (selling), not greed.
Get the rest of this article, including our portfolios and trades, at MktContext.com!
Join 13,000+ investors who are timing the market!