




Nuclear: The Build Cycle the Market Is Underpricing
Cameco's Westinghouse is heading for an IPO, and alongside its Q2 results Cameco disclosed granular data on the potential project pipeline for Westinghouse. The question now is how big the coming build cycle really is, and whether the market is sizing it correctly. We think it is not.
The Market Is Looking at the Wrong Countries
Most attempts to size the nuclear renaissance start and stop with China, the US and Western Europe. That is where the visible pipeline sits, so it is where the analysts look. The problem is that these are the regions furthest along already. The places where we think the demand case is strongest, and least priced, sit outside that list.
It is worth recalling how the last cycle played out. In the 1970s and 1980s, new nuclear build came predominantly from North America and Europe. France alone accounted for 35% of new construction in 1980, following the Messmer plan of 1974, a direct response to the oil crisis that set out to run most of the country's electricity on nuclear for the sake of energy independence. The 1973 oil embargo then sustained a rapid pace of construction for nearly a decade, adding arguably another 75 GW to peak at 230 GW globally by 1980.
Nuclear Reactors Under Construction, Historical Perspective (GW)
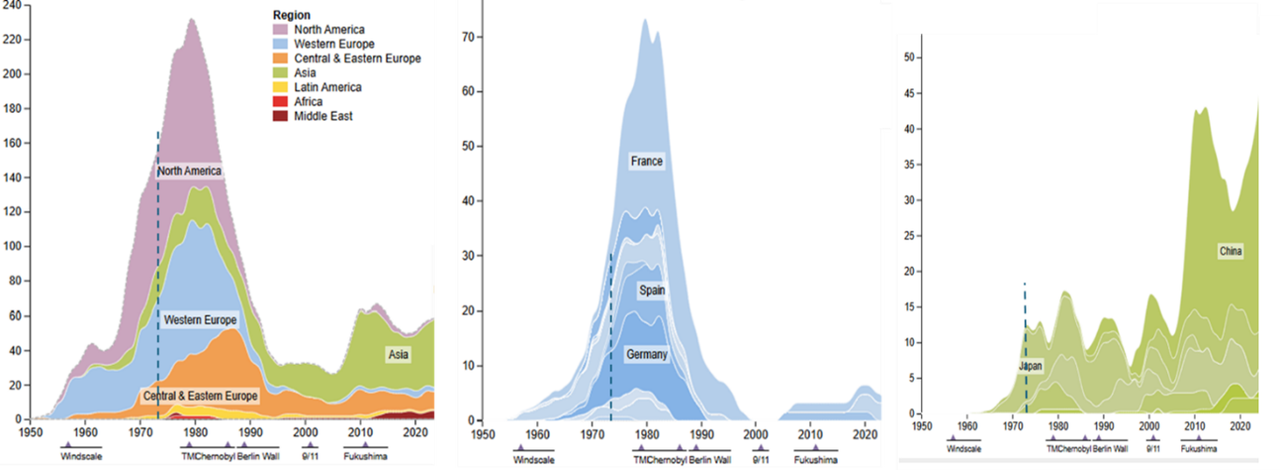
Source: World Nuclear Report, Asymmetric Research. Dotted line marks 1973 (oil embargo)
Energy shocks drive nuclear build, and they drive it in the countries that feel most exposed. In the 1970s that was the oil-importing West. Today, we would argue, the most exposed countries are elsewhere.
So Where Does the Next Wave Come From?
The crisis around the Strait of Hormuz hit some economies far harder than others. Two stand out: Pakistan and Bangladesh, both heavily dependent on Gulf-sourced LNG and oil for their power, and both running electricity systems that are small relative to their populations.
Pakistan is a country of 260 million people, more than three times the population of France, yet it operates just 3.5 GW of nuclear capacity, nearly 20 times smaller than France's fleet. Power consumption per capita sits at around one-seventh of the global average, and load-shedding is routine, running to several hours a day for households and considerably more for industry during the worst stretches. If Pakistan were to lift its energy intensity per capita towards that of a country like Vietnam by 2050, while halving its reliance on Gulf LNG and oil, the implied nuclear target would more than double versus current plans. That is the gap between where policy sits today and where, in our view, energy security points.
Bangladesh is in a similar position. Its first nuclear plant is set to come online this year, and its current plan targets only a modest build-out to 2050. With a population of 175 million and the same room for per-capita energy catch-up, we think those targets are far too conservative, given the same Gulf dependence the crisis has exposed.
Taken together, more aggressive, and in our view more fitting, nuclear policies in Pakistan and Bangladesh alone could add nearly 90 GW of new capacity over the next 15 years, potentially beginning before 2040. For context, that is comparable to the entire operating US nuclear fleet today. None of this is in the consensus pipeline.
What Happened to Uranium Last Time
This matters beyond the reactor builders. In the last cycle, uranium prices stayed flat from the late 1960s to 1973 despite the initial ramp, then re-rated dramatically, soaring 6x between 1973 and 1976 to a nominal high of $40/lb. Adjusting for currency devaluation of 6% per year, that equates to c$700/lb in today's dollars, and we would note that official CPI understates the true erosion of purchasing power.
Historical Nominal Uranium Price, 1968 to 1976 ($/lb)
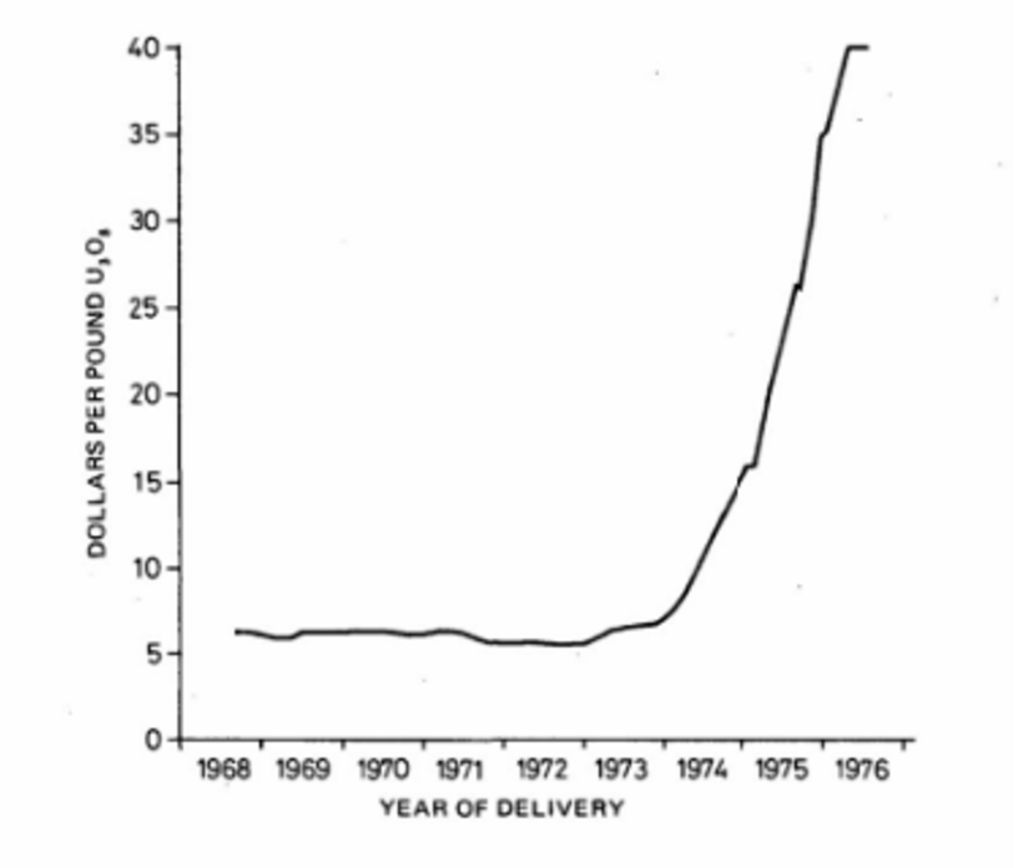
Source: IAEA, Nuclear Exchange Corporation
We are not forecasting a repeat of that number. The point is the shape of it. Uranium went nowhere for years while the build-out gathered pace, then moved violently once the market realised the balance had turned. We suspect that pattern, long quiet then a sharp move, is worth keeping in mind now, into a build cycle we think the consensus is sizing too narrowly.
Where We Go From Here
We have taken Cameco's disclosed pipeline, layered in the South Asian demand we think the consensus is missing, and worked through what it could mean for Westinghouse across a base, bull and conservative case. Readers who want the detailed workings can find them in our research on Asymmetric Research.
Disclaimer: This note is for informational purposes only and does not constitute investment advice or a personal recommendation. Past performance is not indicative of future results. The value of investments and any income from them can go down as well as up, and you may not get back the amount originally invested. Nuclear technology, uranium and related equities are highly volatile. You should seek independent professional financial advice before making any investment decision. The author and Asymmetric Research may hold positions in nuclear technology, uranium and related equities.
[...]