




A 427% Gain In 18 Days

From A Broken Chart To A Closed Trade
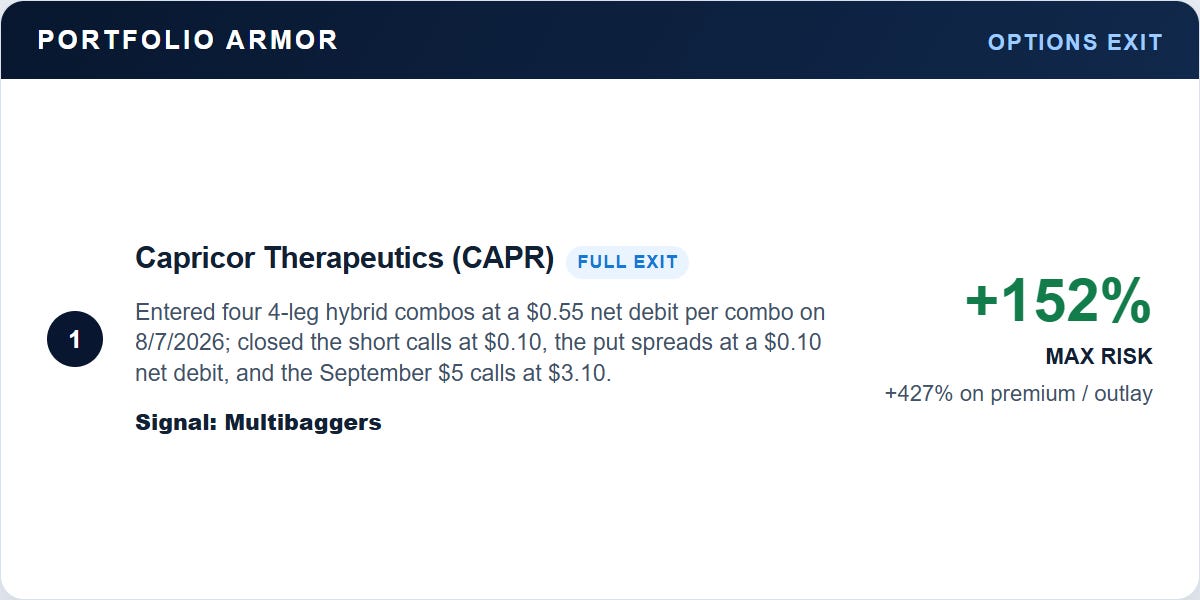
A few weeks ago, in our mid-August post, we wrote about our bullish options trade on Capricor Therapeutics (CAPR). We entered on August 7th and finished exiting on August 25th: a $940 profit in 18 days, or 427% on premium and 152% on actual risk, before fees.
When we entered, CAPR was near $4 after falling nearly 80% from its July 24th close. Its RSI was 12, and its technical rating was 0 out of 10. The attraction was a potential regulatory catalyst. By the time of our Zero Hedge post, the stock had doubled in the premarket.
Here was the original subscriber alert:
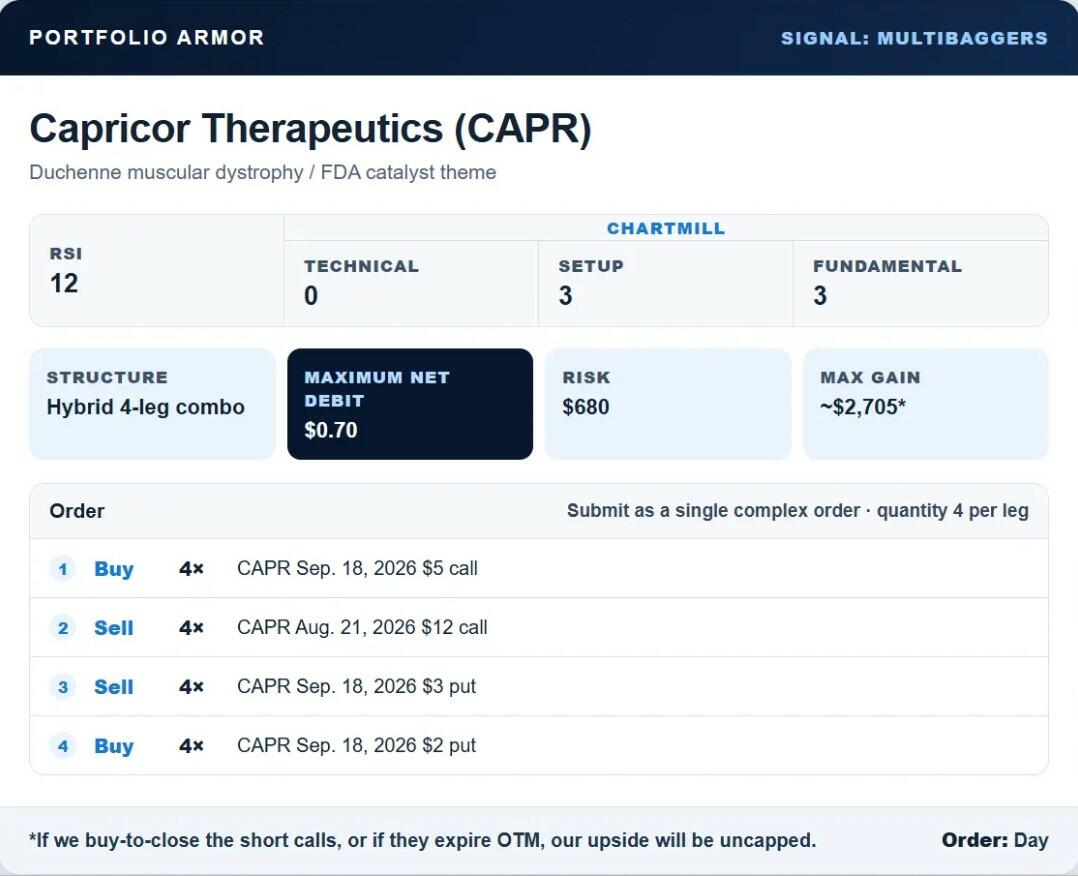
Our actual entry used August $10 short calls by accident, and a $0.55 net debit; the published order card specified August $12 short calls and a $0.70 debit limit. The returns below track the position we entered, but the publish trade performed similarly.
How We Exited
Our position combined September 18th $5 calls, short August 21st calls, and a September 18th $3/$2 put spread, with four contracts in each leg. Here are the actual cash flows:
- August 7th: Entered at a $0.55 net debit, for a $220 initial outlay.
- August 21st: Bought back the short August $10 calls for $0.10, spending $40.
- August 24th: Closed the September $3/$2 put spread at a $0.10 net debit, spending another $40.
- August 25th: Sold the four September $5 calls for $3.10 each, collecting $1,240 and closing the position.
$1,240 − $220 − $40 − $40 = $940 in profit.
Our actual maximum risk was $620: the $220 entry debit plus the $400 maximum loss on the $1-wide put spread. Our $940 profit was 152% on actual risk and 427% on premium, before fees.
Finding The Next Setup
CAPR came from our Multibaggers list of investors who’ve highlighted multiple stocks that subsequently gained 100% or more. In this case, a beaten-down stock, a regulatory catalyst, and an options structure with a low initial debit produced a substantial gain. We posted the closing transactions in the original alert’s comments and recorded the completed result in our public trade ledger.
All Trades, Win Or Lose
We publicly disclose the results of all our trades, win or lose. Through September 4th, our record covered 216 fully exited trades, with an average return of 31.3% on maximum risk.
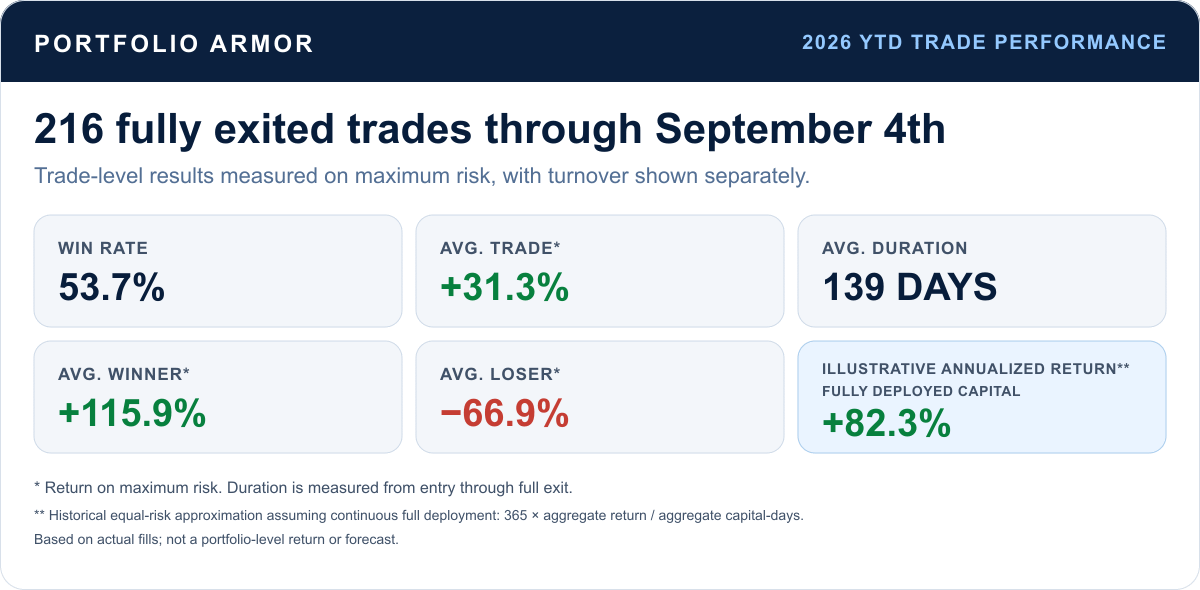
CAPR’s 18-day holding period was shorter than our 139-day average. Even at that average duration, the completed-trade results imply an illustrative 82.3% annualized return, assuming equal capital at risk per trade and continuous full deployment. This turnover estimate uses actual fills on closed trades; account results also depend on position sizes, idle cash, and open positions.
For our trade alerts, exit updates, and an explanation of how we select and structure our trades, start here.