




$105 Oil, 5% Yields, Falling Stocks

Friday Didn’t Erase The Week
Friday’s rebound made the week look less ugly than it felt.
The S&P 500 gained 0.9% Friday, snapping a four-session losing streak, but still fell 0.8% for the week. The Nasdaq lost 0.7%, the Dow fell 1.6%, and the Russell 2000 dropped 2.4%.
The Russell’s underperformance highlighted how higher oil prices and interest rates hit smaller companies hardest, while Friday’s relief rally favored the larger indexes. The week’s central question was whether the renewed energy shock would keep feeding inflation and force the Fed to tighten again.
Oil And Inflation Closed In On The Fed
Brent crude settled at $104.61 Friday, down 2.8% for the session after approaching $110 overnight. That pullback helped stocks bounce, but crude still ended above $100.
The inflation data gave the Fed little room to relax. The Producer Price Index rose 0.4% in August and 5.4% from a year earlier. Final-demand energy prices rose 4.2%, led by a 24.1% jump in diesel. Even excluding food, energy, and trade services, producer prices were up 4.7% year over year.
Friday’s consumer-price report showed prices 3.4% higher than a year earlier. The two-year Treasury yield rose to 4.62%, while the 10-year finished at 4.97%. The market was pricing a greater chance that the Fed would raise rates at its meeting next week.
Oracle’s Reversal Captured The Tape
Oracle initially jumped 8.5% Friday after reporting stronger revenue and profit than analysts expected. It finished down 1.7%.
That reversal captured the week’s tension. The AI infrastructure buildout continues to produce operating growth, but a higher discount rate raises the hurdle for every long-duration story. We made the infrastructure case in Wednesday’s free post.
The tape still rewarded strong company-specific setups. It simply demanded more price discipline.
How We Traded It
Tuesday’s alert produced one fill from three proposed structures: a precious-metals trade. The cybersecurity and photonics orders expired unfilled.
Wednesday gave us one fill from two proposals: a cybersecurity trade. The precision-oncology order expired unfilled.
Thursday’s three proposals produced two fills, both in healthcare. The RFID-related order expired unfilled.
Friday brought five more proposals. An industrial trade and a cloud-communications trade filled; the RFID retry, data-storage order, and psychedelics trade expired unfilled.
Six of the week’s thirteen proposed structures filled, each within its published limit. The other seven expired unfilled.
Five Partial Exits, Nine Full Exits
This week’s Exits post contains five partial exits and nine completed trades.
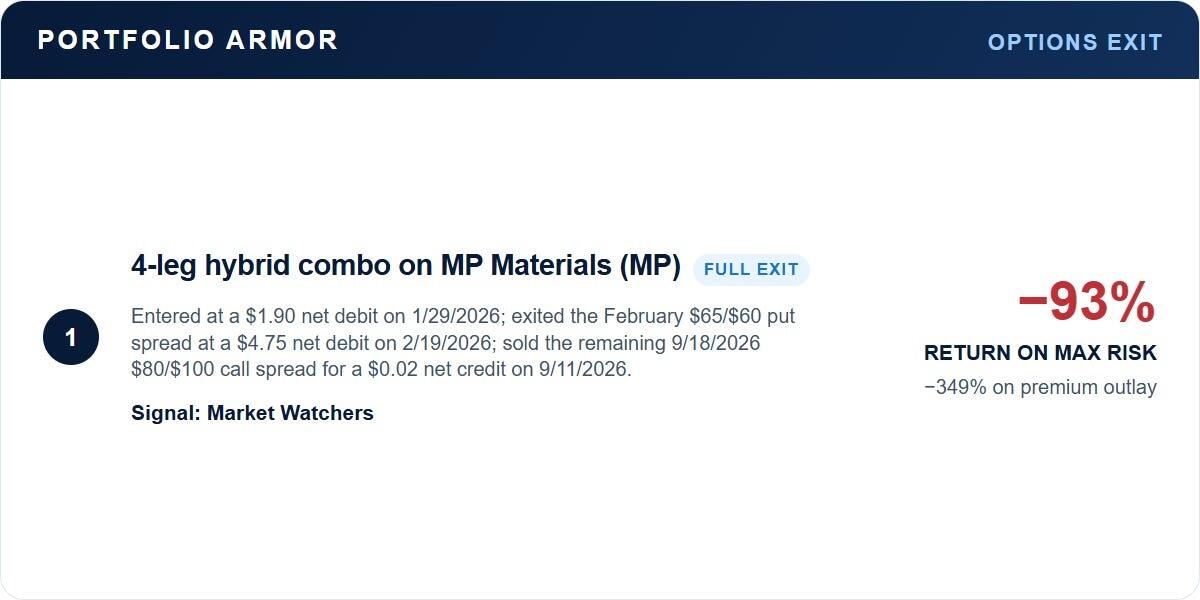
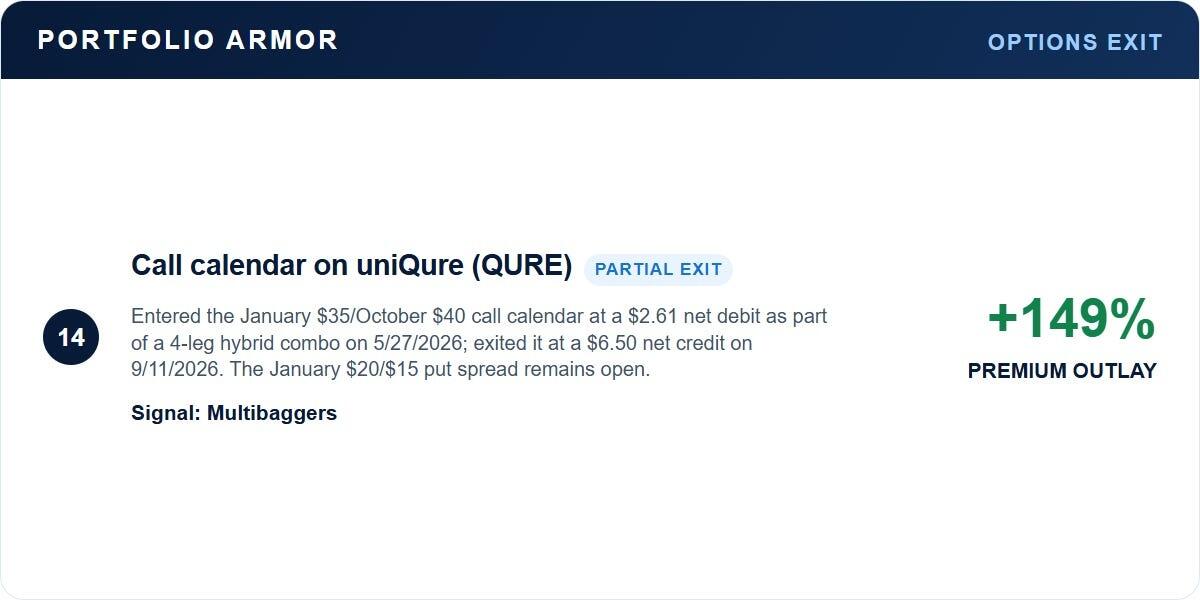
The week’s range ran from a 93% loss on maximum risk in MP Materials to a partial exit from our uniQure call calendar. We entered the calendar for a $2.61 net debit and sold it for a $6.50 net credit, a 149% gain on premium outlay. The January $20/$15 put spread remains open, so the trade’s return on maximum risk isn’t final. It was well out of the money at Friday’s $44.51 close, after uniQure submitted an AMT-130 BLA seeking accelerated FDA approval and filed a U.K. marketing authorization application.
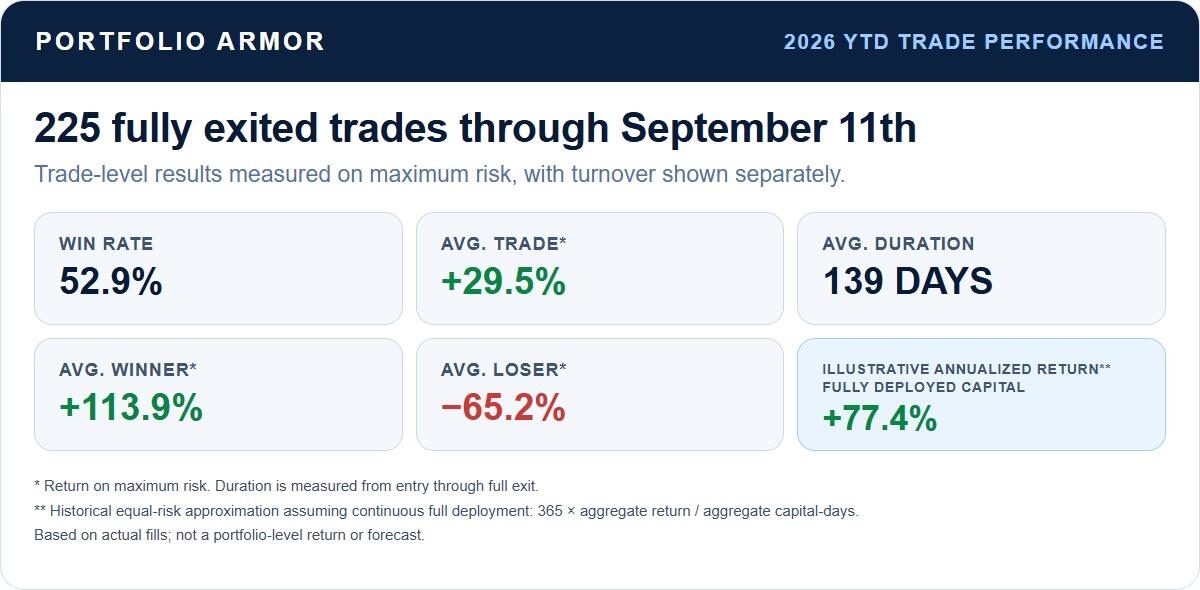
The nine completed trades pulled down the year-to-date averages. Through September 11, our 225 fully exited 2026 trades had a 52.9% win rate and averaged 29.5% on maximum risk. The average winner returned 113.9%; the average loser fell 65.2%. The average holding period was 139 days.
The Fed Gets The Next Move
The Fed meets September 15–16 with oil above $100, producer prices up 5.4% year over year, consumer inflation at 3.4%, and the 10-year Treasury yield pressing against 5%.
A rate increase would add pressure to equity multiples and borrowing costs. A pause paired with a hawkish message could keep the same pressure in place. Either way, the market enters next week with less room for weak earnings, loose entry prices, or crowded exposure.
We’ll keep looking for companies with strong operating evidence, supportive technicals, and option prices that preserve the asymmetry.
If you’d like to see how we select these trades, set entry prices and exits, and track every completed result, start here: