




The market narrative seems obsessed with analysing the Fed Chairman’s independence from the US Administration, with the latest rate hike being seen as thwarting the President’s wishes. In our view, this largely misses the point. We propose that Chairman Warsh is a conservative Central Banker facing an Institution staffed with and governed by brilliant PhD economists and a fawning media that can only understand policy through the lens that academicians have afforded them. In this context, Warsh’s conservativism is radical but places him in a precarious position. Viewed by those inside the Institution and by its commentariat, he is insufficiently qualified for the task at hand. His only card, and his trump card, is that whatever their brilliance, however many papers they have published, however long they have served, they have failed. For 65 consecutive months, the Fed’s preferred inflation gauge, has come in above its 2% target.Warsh’s push to shrink the Fed’s balance sheet could mean lower short rates, higher long yields and continued support for gold through expanding private credit.
His repeated refrain, that he will deliver price stability and that 2% remains his target gives him the freedom to manoeuvre. A rate hike is a small price to pay. His belief system lacks the mathematical elegance and models of the new orthodoxy. He must stress their failure and be credible on inflation. He must convey that his opponents also have a belief system and not a precise scientific method and that for over 5 years, a duration which would not be tolerated anywhere else, they have failed. The question is, what is he trying to achieve? Let us examine his words.
Price Stability, Employment and the Phillips Curve
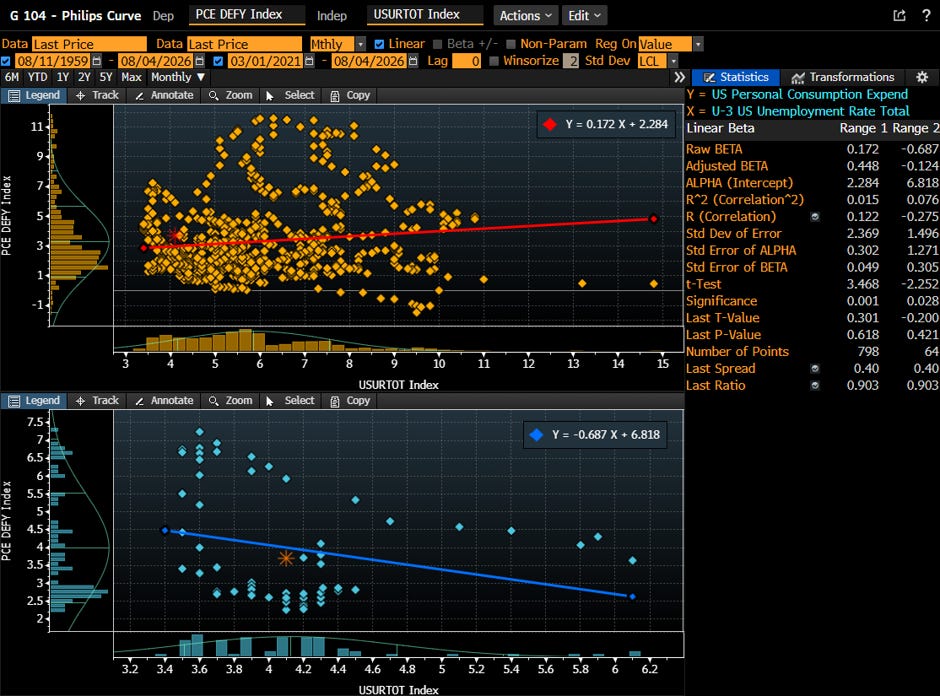
Is there any evidence for the strict tradeoff known as the Phillips Curve? This is represented simply in Chart 1 with the inflation rate on the x-axis and the unemployment rate on the y-axis. A strict tradeoff would be represented by a line sloping downwards from the top left of the chart to the bottom right, with the scatter dots clustered tightly around the line. The intuition being that inflation is cured by a recession – higher unemployment (that is brought about by higher interest rates). The top chart shows the period for which we have data, from 1959 to present. We’ll leave it to the reader to decide whether such a relationship is present. The bottom chart presents the recent period under which the PCE measure of inflation has exceeded 2% - the failure of the current Board of Governors. The slope of the line is in the right direction, but the clusters are so widely distributed that the relationship has no statistical significance whatsoever.
Chart 1
The Neutral Rate and Policy Operation
But if the suggestion is somehow we’re going to be fine-tuning aggregate demand so it catches supply, that’s not my mental model. I don’t think we’re great in the fine-tuning business .
And then,
In a word, no. In a few words, I’d say this. I’ve always been interested in a neutral rate as an academic matter. Back when I learned economics, we used to think of it as a Wicksellian rate. It’s a real equilibrium rate. It’s useful academically. It’s, it’s a discussion to help us think about policy. Do I think it has any operational effect on decisions that we make today? No, I don’t .
Goodbye R*, he’s more interested in operations than in academic models. He’s a Central Banker, not an Economist. He appears to be dismantling the economic priesthood that governs the Federal Reserve. Shots fired.
The Fed’s Balance Sheet and Monetary Transmission
Finally, we discussed monetary policy tools and strategies for achieving stable prices. If, as the Fed has long held, interest rate policy should be its primary monetary policy instrument, how much accommodation are we getting from the balance sheet?
We note that the Chairman reinforces interest rates as the primary monetary policy instrument. We can infer that he perceives the balance sheet as being accommodative and that financial conditions are, therefore, too loose.
In terms of transmission mechanisms of monetary policy, I think different tools work through different transmission mechanisms. The interest rates work through lending channels, and credit channels, maybe confidence channels and foreign exchange. The balance sheet probably works through some other channels, like signaling and portfolio balance .
We further note that the mental model of the Chairman sees these different tools operating through different channels. We introduce the potential that both tools could operate, for a time at least, in opposition . We shall explore this later.
QE and the Price of Duration
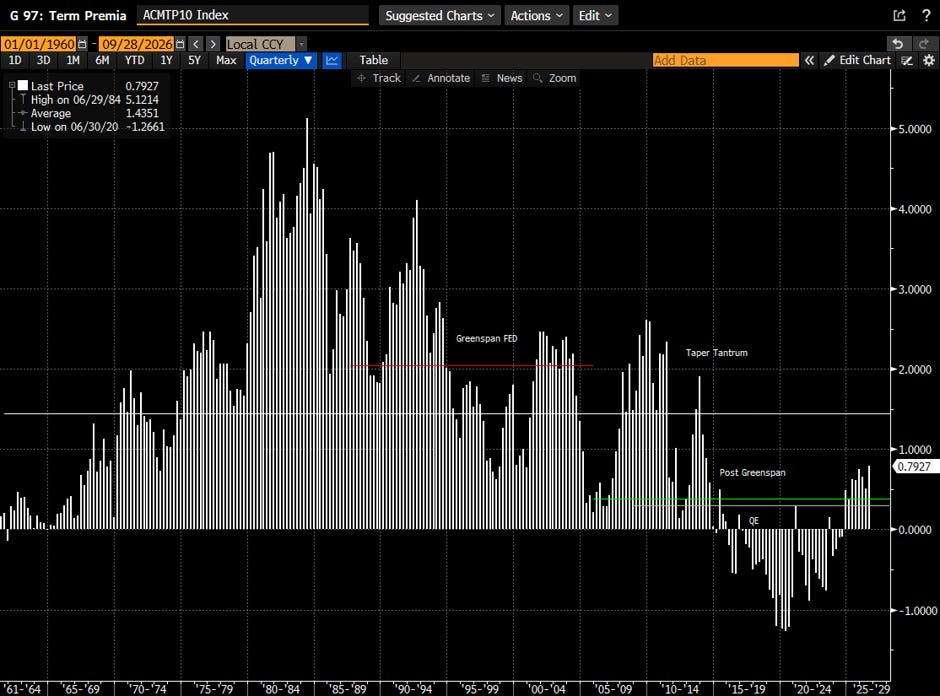
In terms of financial markets, the price of risk has fundamentally changed. As an example, in Chart 2 we show the ACM Term Premium on the US 10-year note since the 60s. The long horizontal white line shows an average premium of 143.5bp over the entire period. Under Greenspan (red line) the average was much higher. Post Greenspan (green line), Bernanke tried to restore some normality but panicked under the “Taper Tantrum”. Under the operations of QE (smaller horizontal white line), the premium was often NEGATIVE and, on average, small positive.
Chart 2
So politicised is the Fed balance sheet, and the largesse it affords Administrations, that sustained shrinkage will meet resistance. As such, the Chairman has appointed a specific task force to audit the Fed’s current “ample reserves” framework. We await the outcome with interest.