


Hot Inflation, Cold AI

Inflation Heated Up. AI Cooled Down.
AI stocks took a beating last week as investors questioned how the next wave of data centers would be financed. Hot inflation added to the pressure: September consumer prices rose 0.6% in a month and 3.7% from a year earlier. Producer prices jumped 1.3% in September.
Friday extended the damage. The S&P 500 fell 1.1% and the Nasdaq Composite lost 2.1%. Energy shares held up better as Brent crude settled at $109.86 a barrel.
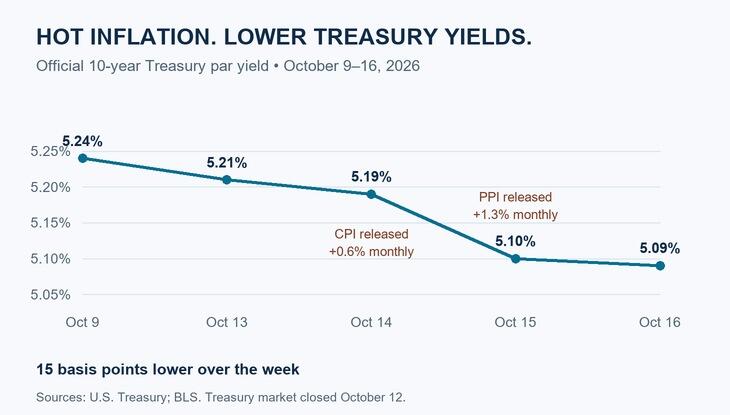
Treasury bonds rallied through it. The official ten-year par yield fell from 5.24% to 5.09% between October 9th and October 16th. Investors were buying government debt while demanding much higher yields from some of the companies financing the AI buildout. The chart below shows the decline in Treasury yields.
Demand And Financing Are Different Questions
Taiwan Semiconductor Manufacturing Company (TSMC) offered fresh evidence of strong chip demand on Thursday. It reported $46.72 billion in third-quarter revenue, up 41.2% from a year earlier, and forecast $52.3–$54.3 billion for the fourth quarter.
Meanwhile, CoreWeave (CRWV -6.28%↓) and other heavily financed data-center businesses faced a harsher verdict in the credit market. Zero Hedge’s Friday market wrap traced the selloff from widening borrowing costs into AI stocks. Our view is that the suppliers’ orders and their customers’ ability to pay both deserve close attention. Growing demand can support earnings while expensive financing limits new capacity.
How We Traded It
Monday: Our first alert paired growing AI memory demand with a fresh Top Names ranking and technical entry signal. The bullish trade filled on Micron (MU -3.13%↓). As with our July entry, it appears we were a little early with this re-entry. Hopefully, this one will end up in the black too.
Tuesday: The enforcement-capacity trade focused on converting government spending into recurring operating revenue. That bullish order filled too.
Wednesday: Cash generation and clinical efficacy gave us two different bullish setups. The biotech trade filled after we repriced it intraday and raised the entry limit; the cash-generation trade filled too.
Thursday: A re-entry and an earnings bet combined a former biotech winner with a bearish setup on a retailer tied to pressure on consumer spending. We opened the biotech trade; the bearish order didn’t fill.
Friday: No New Entries
We didn’t place any new trades on Friday because Thursday night’s triage didn’t turn up any compelling ideas on either the long or short side.
Exits And The Risk/Return Tradeoff
Options-expiration week brought a cluster of losing exits. The broader issue is concentration: several valid signals can reverse together when a strong investment theme sells off.
We’ve been giving fundamentals more weight in security selection, while weekly Runner Reviews reassess targets for uncapped options. Friday’s Exits post covers the results and the lessons:
Three Ways To Use The Edge
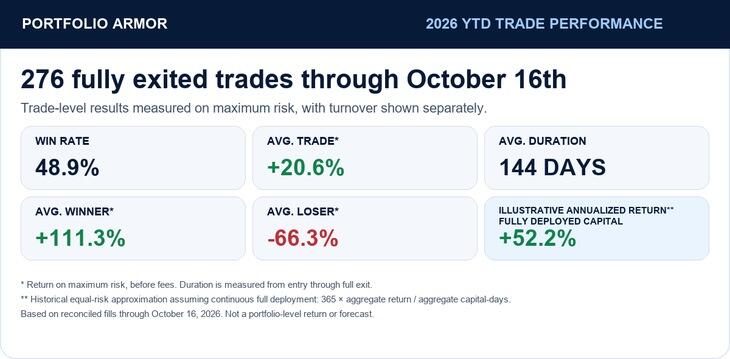
Our year-to-date record puts last week in context. Through October 16th, 276 completed trades averaged 20.6% on original maximum risk, before fees:
Portfolio Armor’s security selection system can also be used to buy shares of its Top Names or construct a portfolio hedged against a chosen decline limit. The graphic below compares those approaches with options trading, using simplified annualized illustrations:
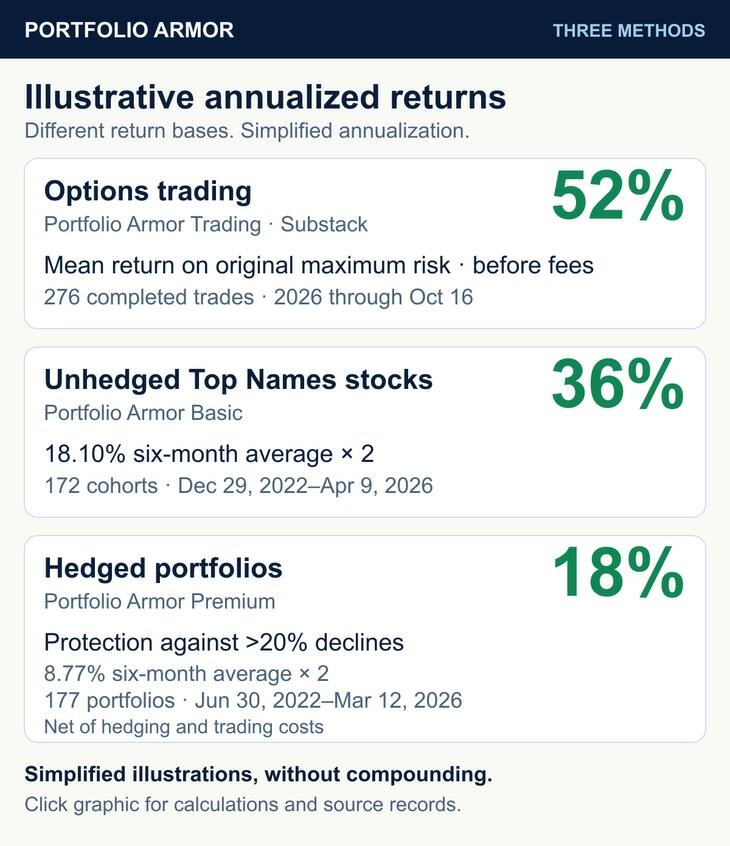
Calculations and source records.
What We’re Watching Next
Tesla reports on October 21st, after the close. Its margins and outlook will put a financial checkpoint alongside the Roadster demonstration we discussed on Friday. The Federal Reserve’s next policy meeting is October 27th–28th.
For the AI buildout, we’ll watch customer commitments, supplier results and financing costs together. For our next trades, we’ll keep looking for company-specific catalysts and stocks that pass the quantitative entry screens at attractive options prices.
From AI memory to clinical catalysts, our alerts give subscribers the company names, option structures and exit plans before we place our trades. Become a paid subscriber to receive them, or subscribe free for the public posts.
Our Start Here page includes a public sample alert and explains how we structure and manage our trades.