


The 1970s Inflation Chart Everyone's Sharing, and What It Means for Gold
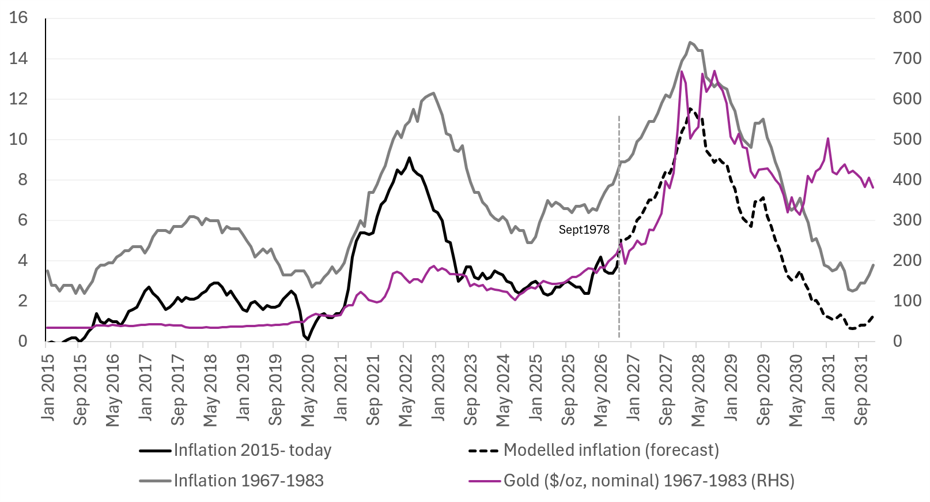
There is a chart circulating again on social media and Substack comparing the trajectory of US inflation between 1967-1983 and 2015 to today. It was previously popularised by the Kobeissi Letter.
We published a piece in early June examining precisely this chart, dissecting the underlying data and using it to model the potential trajectory of gold prices.
For some time before that report, we had argued that inflation was likely to re-accelerate. Our base case was that we were in the early stages of a 1970s-style inflationary cycle, a thesis reinforced by the Iran conflict, which we viewed as a clear parallel to the 1973 oil embargo.
But our question in that report was different: what if we were using the wrong starting point for the 1970s analogy? Having already experienced the first major inflationary wave four to five years ago, what if we were effectively in September 1978 (June, at the time of our report), with a potentially much larger inflationary surge still ahead of us?
We modelled where CPI could head if the historical relationship held and we were indeed at the equivalent of September 1978. The model pointed to US inflation gradually rising over the following two years, reaching 12% and surpassing the 9% peak recorded in 2022.
Gold peaked in January 1980, approximately five months before CPI reached its peak. If that relationship were to repeat, our model implied that gold could embark on a sustained upward run from March 2027 through January 2028, potentially rising by 2.7x.
US CPI inflation, 2015-present versus 1967-1983, with modelled path and 1967-1983 nominal gold (RHS)
Source: Asymmetric Research, BLS, Macrotrends. Inflation overlay adapted from the Kobeissi Letter
To be clear, we remain gold bulls and believe we are in a structural bull market. However, the speed and magnitude of the move implied by this model are not our base case. This is a theoretical exercise, not a price target or a forecast we are underwriting.
Nevertheless, it is an interesting framework to monitor. And the point worth making now is this: since our June analysis, the inflation trend has been broadly tracking the model. It is still early, and the analogy could invalidate at any point. But four months on, the data has not diverged materially from the path we laid out, which is reason enough to keep watching it closely. We will continue tracking how the inflation data evolve to assess whether the historical analogy is being validated or invalidated.
We remain overweight gold and gold equities.
———
For our key valuations across the gold equities space, gold price sensitivities and more, subscribe to Asymmetric Research.
asymmetricresearch.substack.com
***
Disclaimer: This article is for informational purposes only and does not constitute investment advice or a personal recommendation. Past performance is not indicative of future results. The value of investments can go down as well as up. Readers should seek independent professional financial advice before making any investment decision. We hold positions in gold and related equities.