
3 Mega-Cap Charts We Are Watching
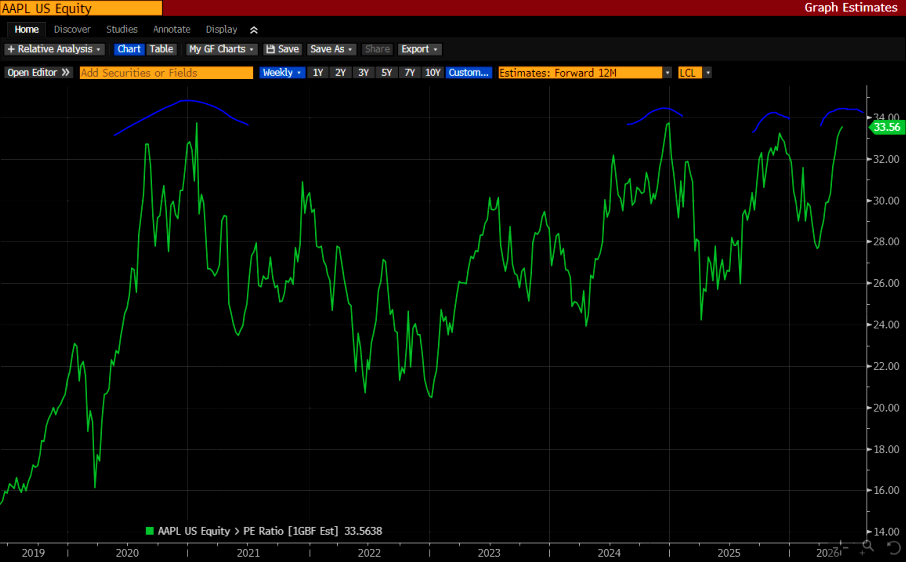
AAPL valuation
Apple's forward P/E multiple is bumping up against multi-year highs. The relative valuation chart versus the S&P 500 looks similar, with Apple trading at a 60% premium to the S&P 500 on a forward P/E basis. Similarly, AAPL's relative performance versus the S&P 500 is also bumping into the high end of recent trading ranges (GS Trading Desk).