
8 Charts Challenging the ‘Buy the Dip’ Narrative
Once a decade
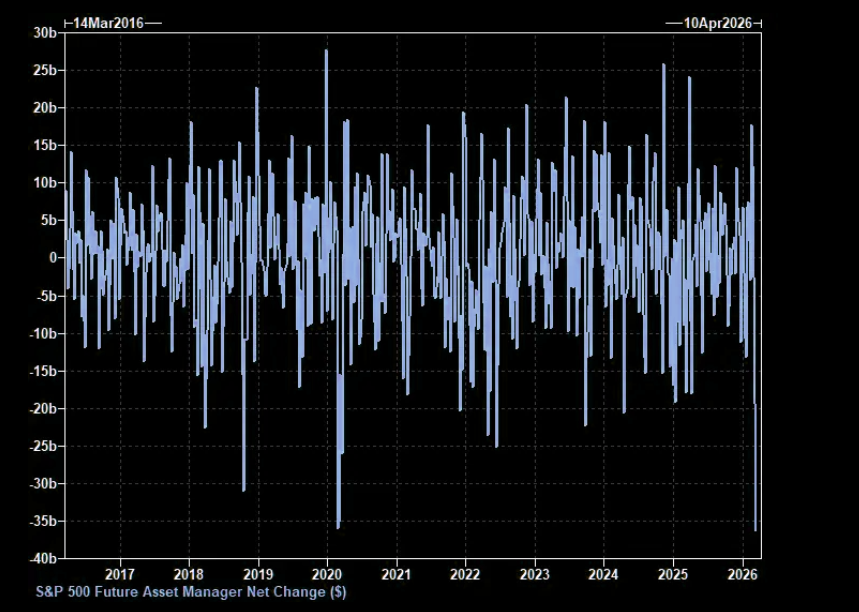
Two Friday the 13ths in a row isn’t something you see often (once a decade!) – and judging by the tape last week, markets might be just a little superstitious too. During March 3rd - 10th, Asset Managers sold $36bn per Commitment of Traders, marking a 10+ year record in notional terms. There are plenty of contrarian extreme signals like this one that would indicate a tradeable low, but there are even more indicators that are far from extreme. Here are 8 charts that do not support the "must buy the dip as a contrarian" case.