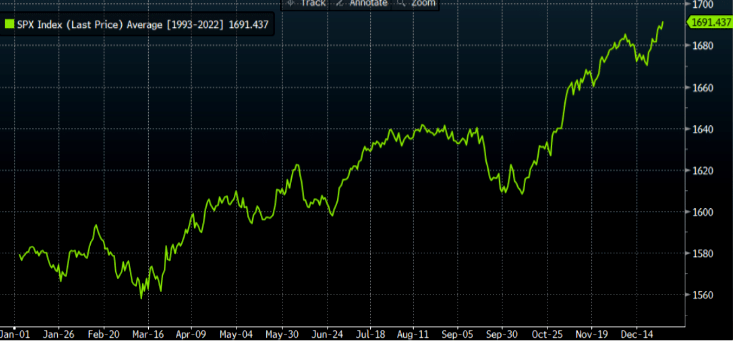
Intra-year seasonality
The chart shows the intra-year seasonality of S&P over the past 30 years. In this illiquid and news-slow August, this might be the most important chart to explain current price action and also zeitgeist (everyone agrees that we should trade down but very few think we have peaked for the year).
Everything is back to January 2022
Source: BofA Quant
Actually just a very normal correction
Source: Ryan Detrick
Is it summer ‘08 or spring ‘12?
Source: Macrobond
Source: Macrobond
Real swap rate reaches multi-year high
Source: Macrobond
Rising real rates a constraint on P/E’s
Source: Barclays
Equities are looking more and more expensive
Source: Flow Show
Macro mavens in long bonds
Source: JPM
Industrial metals
Source: Macro Strategy