print-icon
print-icon

Risk ripples

SPX - massive levels

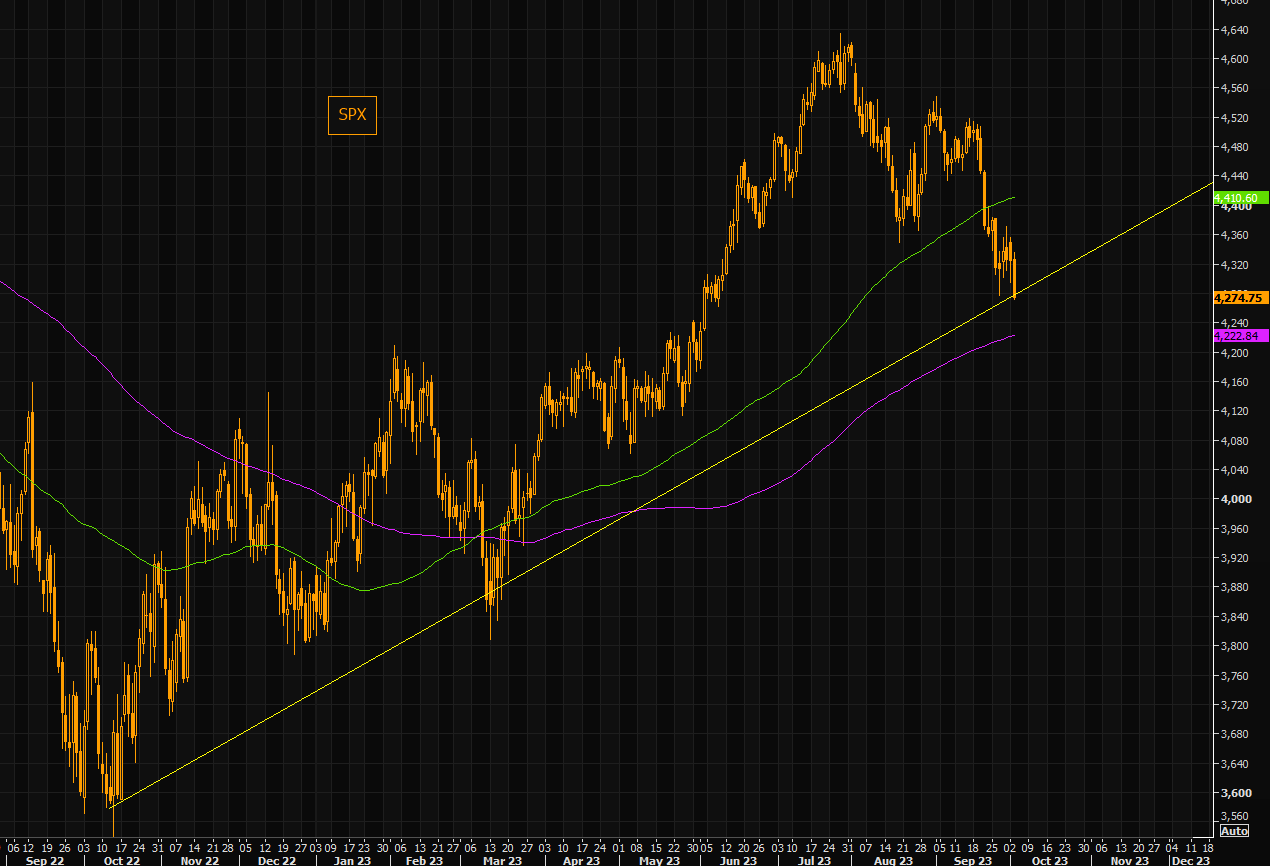
SPX could be breaking below the huge trend line that has been in place since last October. We are well below the 100 day...and closing in on the 200 day, currently around the 4220 area.

Source: Refinitiv


The Jaws gap

The gap between NASDAQ and the US 10 year (inverted) remains absolutely massive. Chart 2 shows the shorter term view. The rates narrative is alive...

Source: Refinitiv


Source: Refinitiv


Lower for higher

The crowd mainly sees rates moving lower into year end...

Source: JPM


Up almost 100% since mid September

The panic in the VXTLT is huge...

Source: Refinitiv


Mexican butterflies

In early September, when VIX was trading around 13.5/14, we pointed out the "funny" moves in the MXN. We wrote: "You don't trade the VIX on the back of MXN volatility, but you pay close attention to whether or not something is going on beyond just the "simple" stuff..." Fast forward to today and those two "risky" charts are much more aligned. Risk is global...

Source: Refinitiv


Mad goes madder

Edwards' "mad" chart is going even madder.

Source: Soc Gen


Nikkei - breaking bad(ly)

Darling long Nikkei is puking below key levels. The latest px action in the JPY isn't helping...We are well below the 100 day, but the 200 day remains way lower. Lot of pain here...

Source: Refinitiv


Computers in Japan

CTAs are "motivated" sellers of Nikkei here...

Source: BofA


Extreme fear

We are moving into even deeper extreme fear territory. We have not seen this much fear in a very long time...

Source: CNN


Source: CNN


Blackout

The corporate bid is in hibernation at the moment...

Source: GS


See TME's daily newsletter email above. For the 24/7 market intelligence feed and thematic trading emails, sign up for ZH premium here.

0
Loading...