Tech Is Breaking. Credit Is Screaming. The Machines Are Next.
The risk-off machine
Tech is losing its footing. The Nasdaq and semis are breaking major levels, credit stress is flashing warning signals and volatility is waking up. Meanwhile, the machines are sitting on massive downside selling potential, Goldman's risk indicator is plunging and oil longs are getting slaughtered. Valuations are finally resetting, but don't confuse cheaper with cheap enough. Is this another violent shakeout, or are we watching the early stages of something much nastier?
Boom
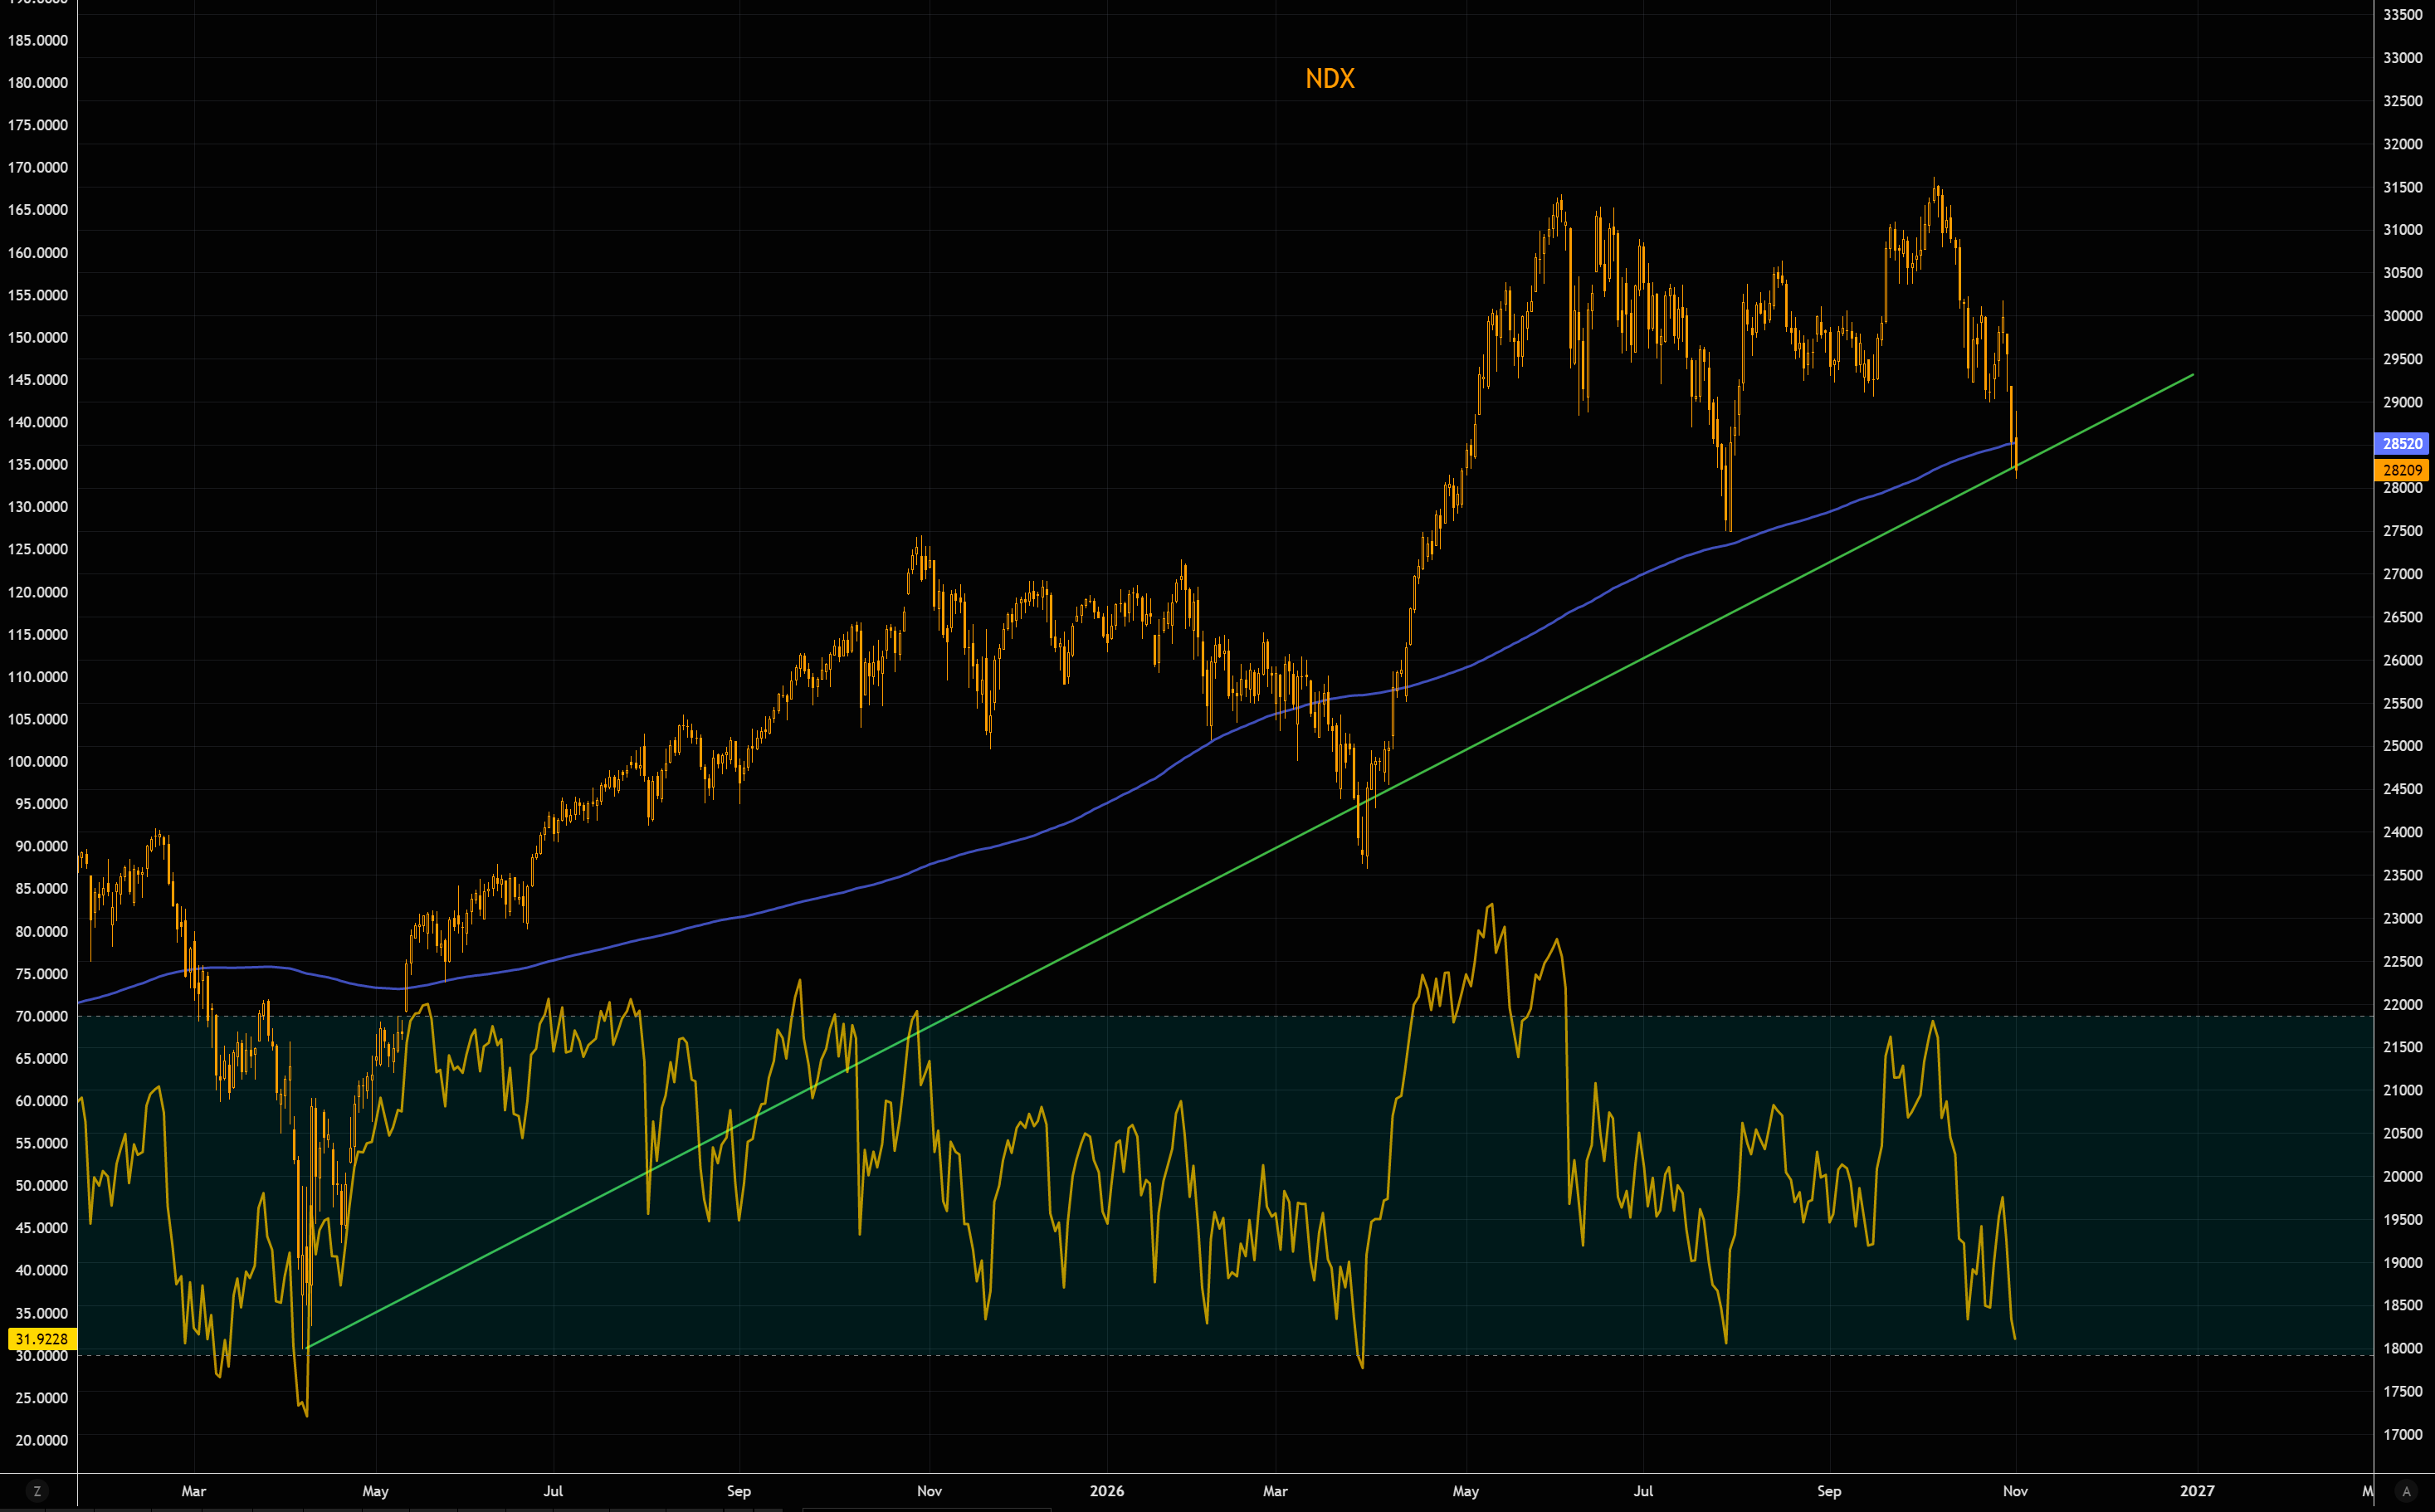
NDX is closing below its 200-day moving average for the first time since March, with RSI hitting its most oversold levels since July and approaching the extremes seen during the March panic. Note the major trend line coming in right around these levels.
Source: LSEG Workspace
Holy SmOX
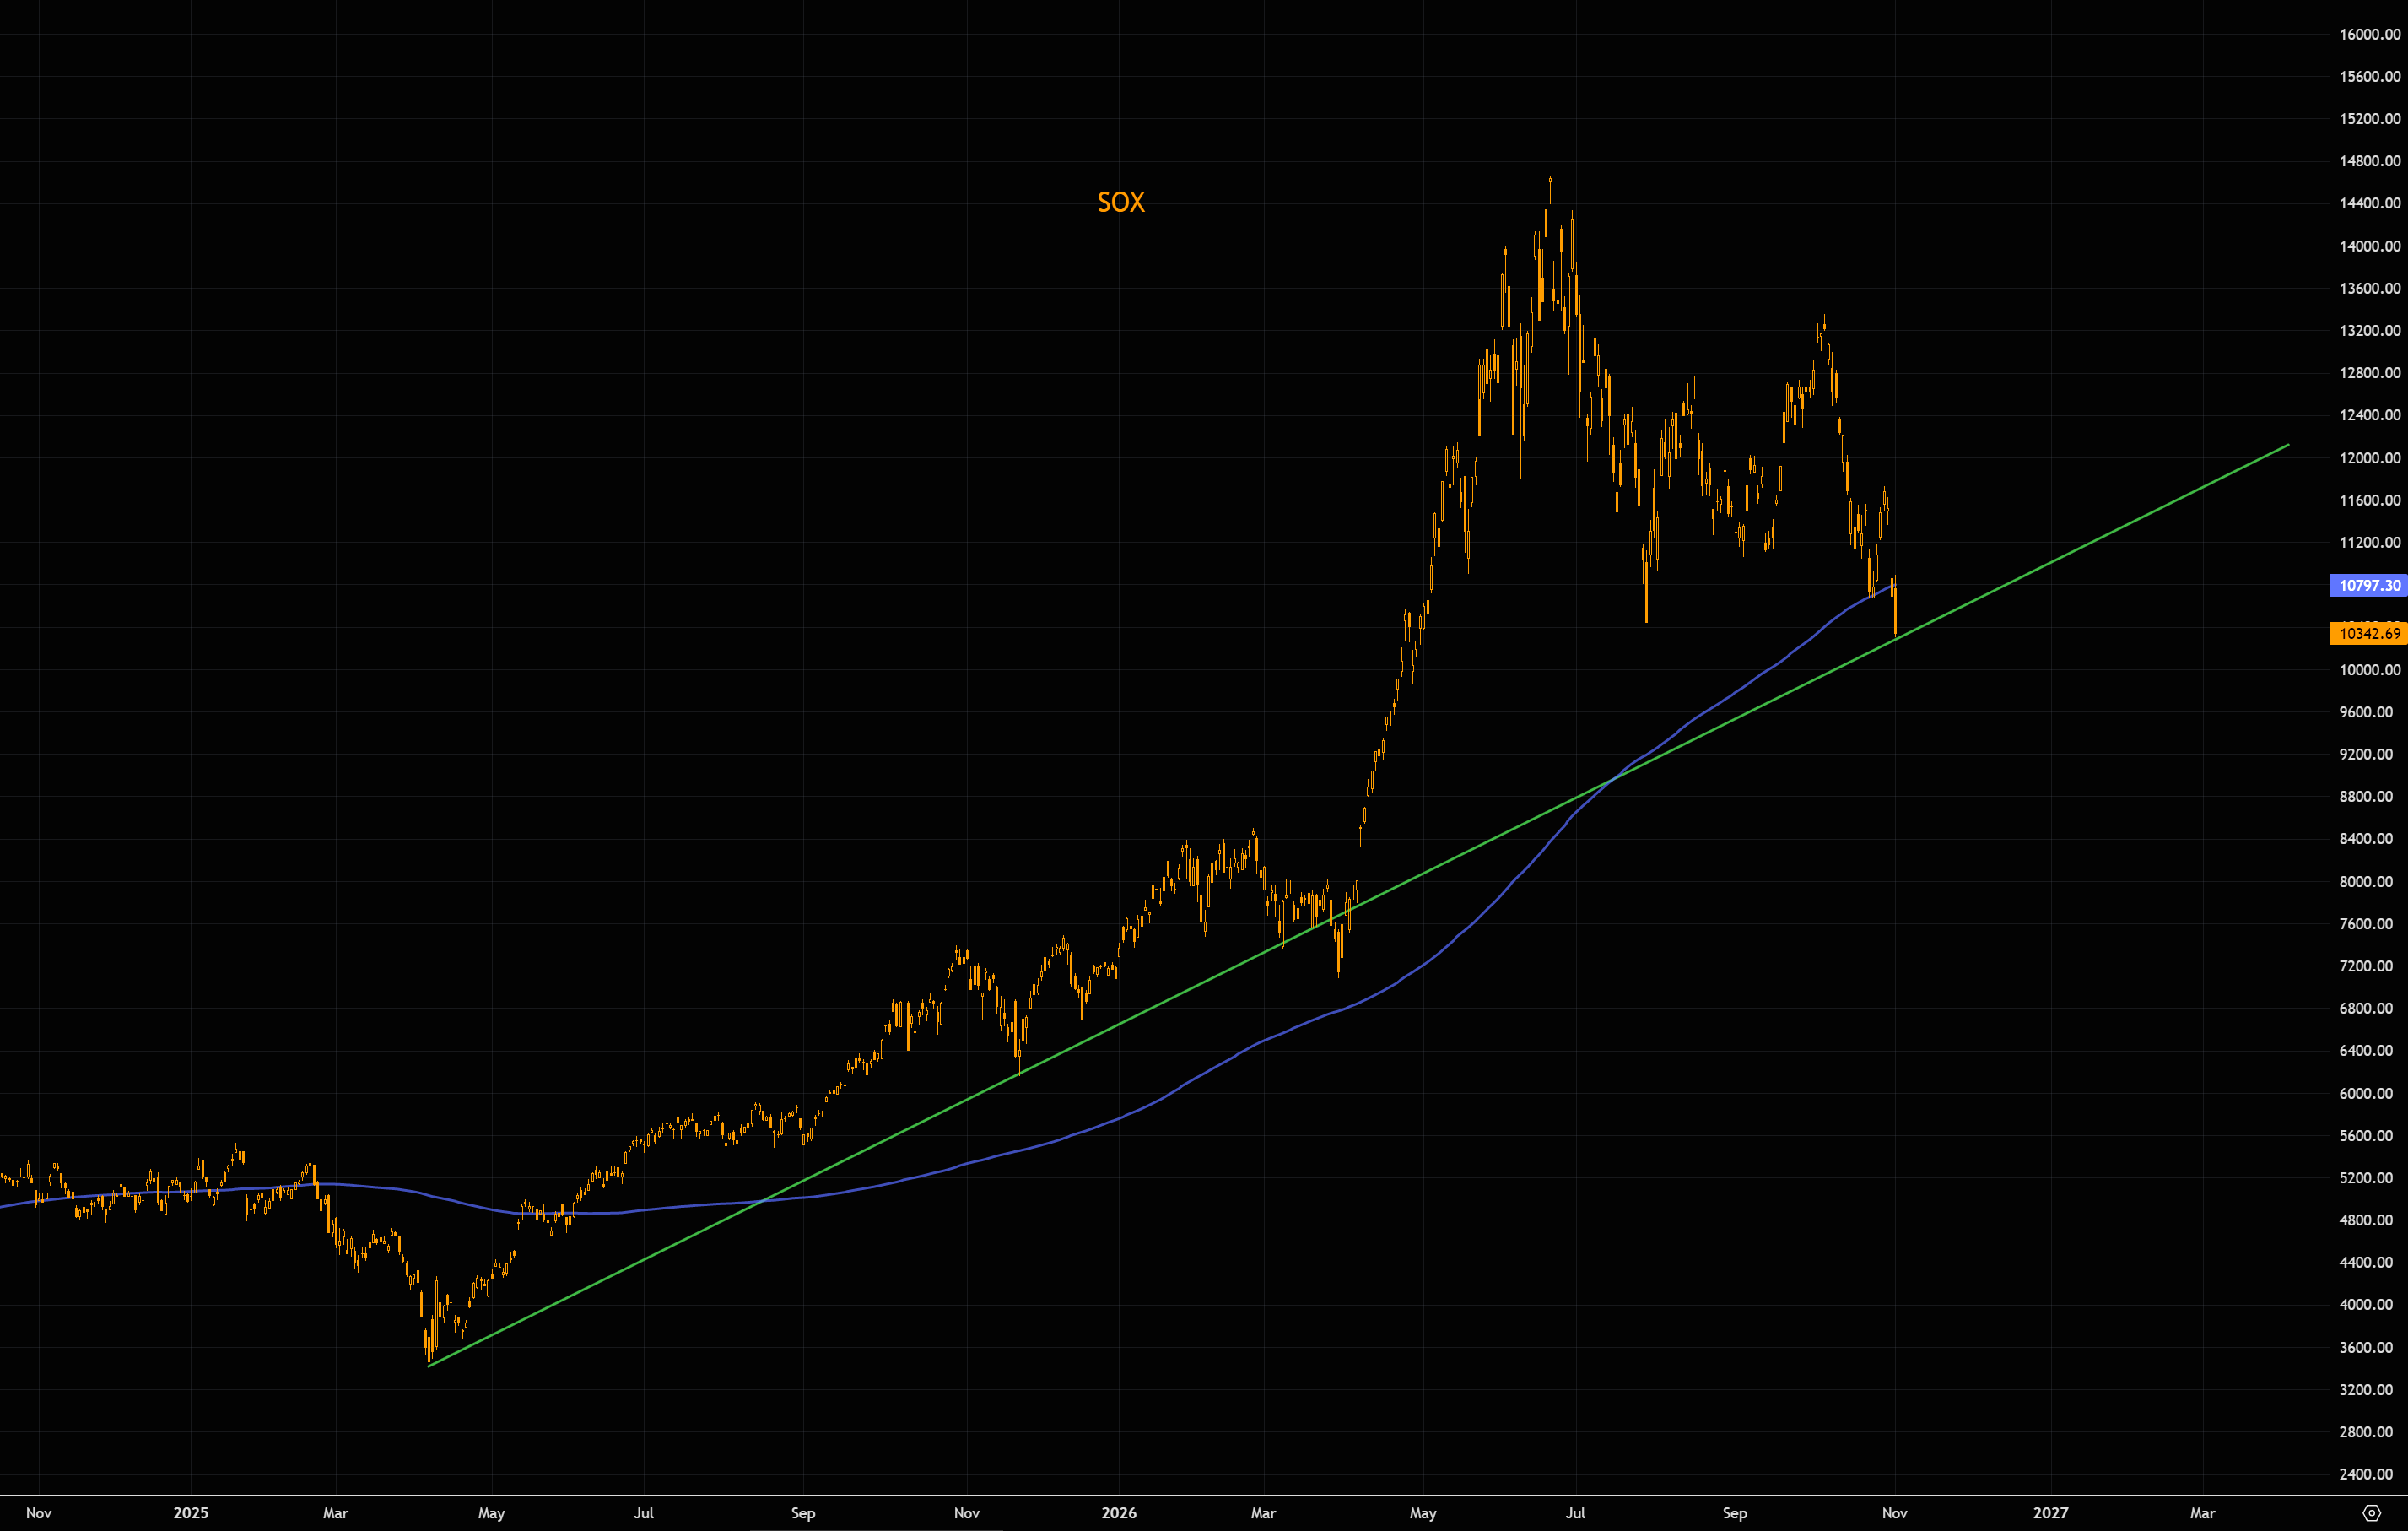
SOX is closing decisively below its 200-day moving average for the first time since May 2025. The longer-term trend line is the last major support, but momentum remains awful. More here.
Source: LSEG Workspace
When you put it this way
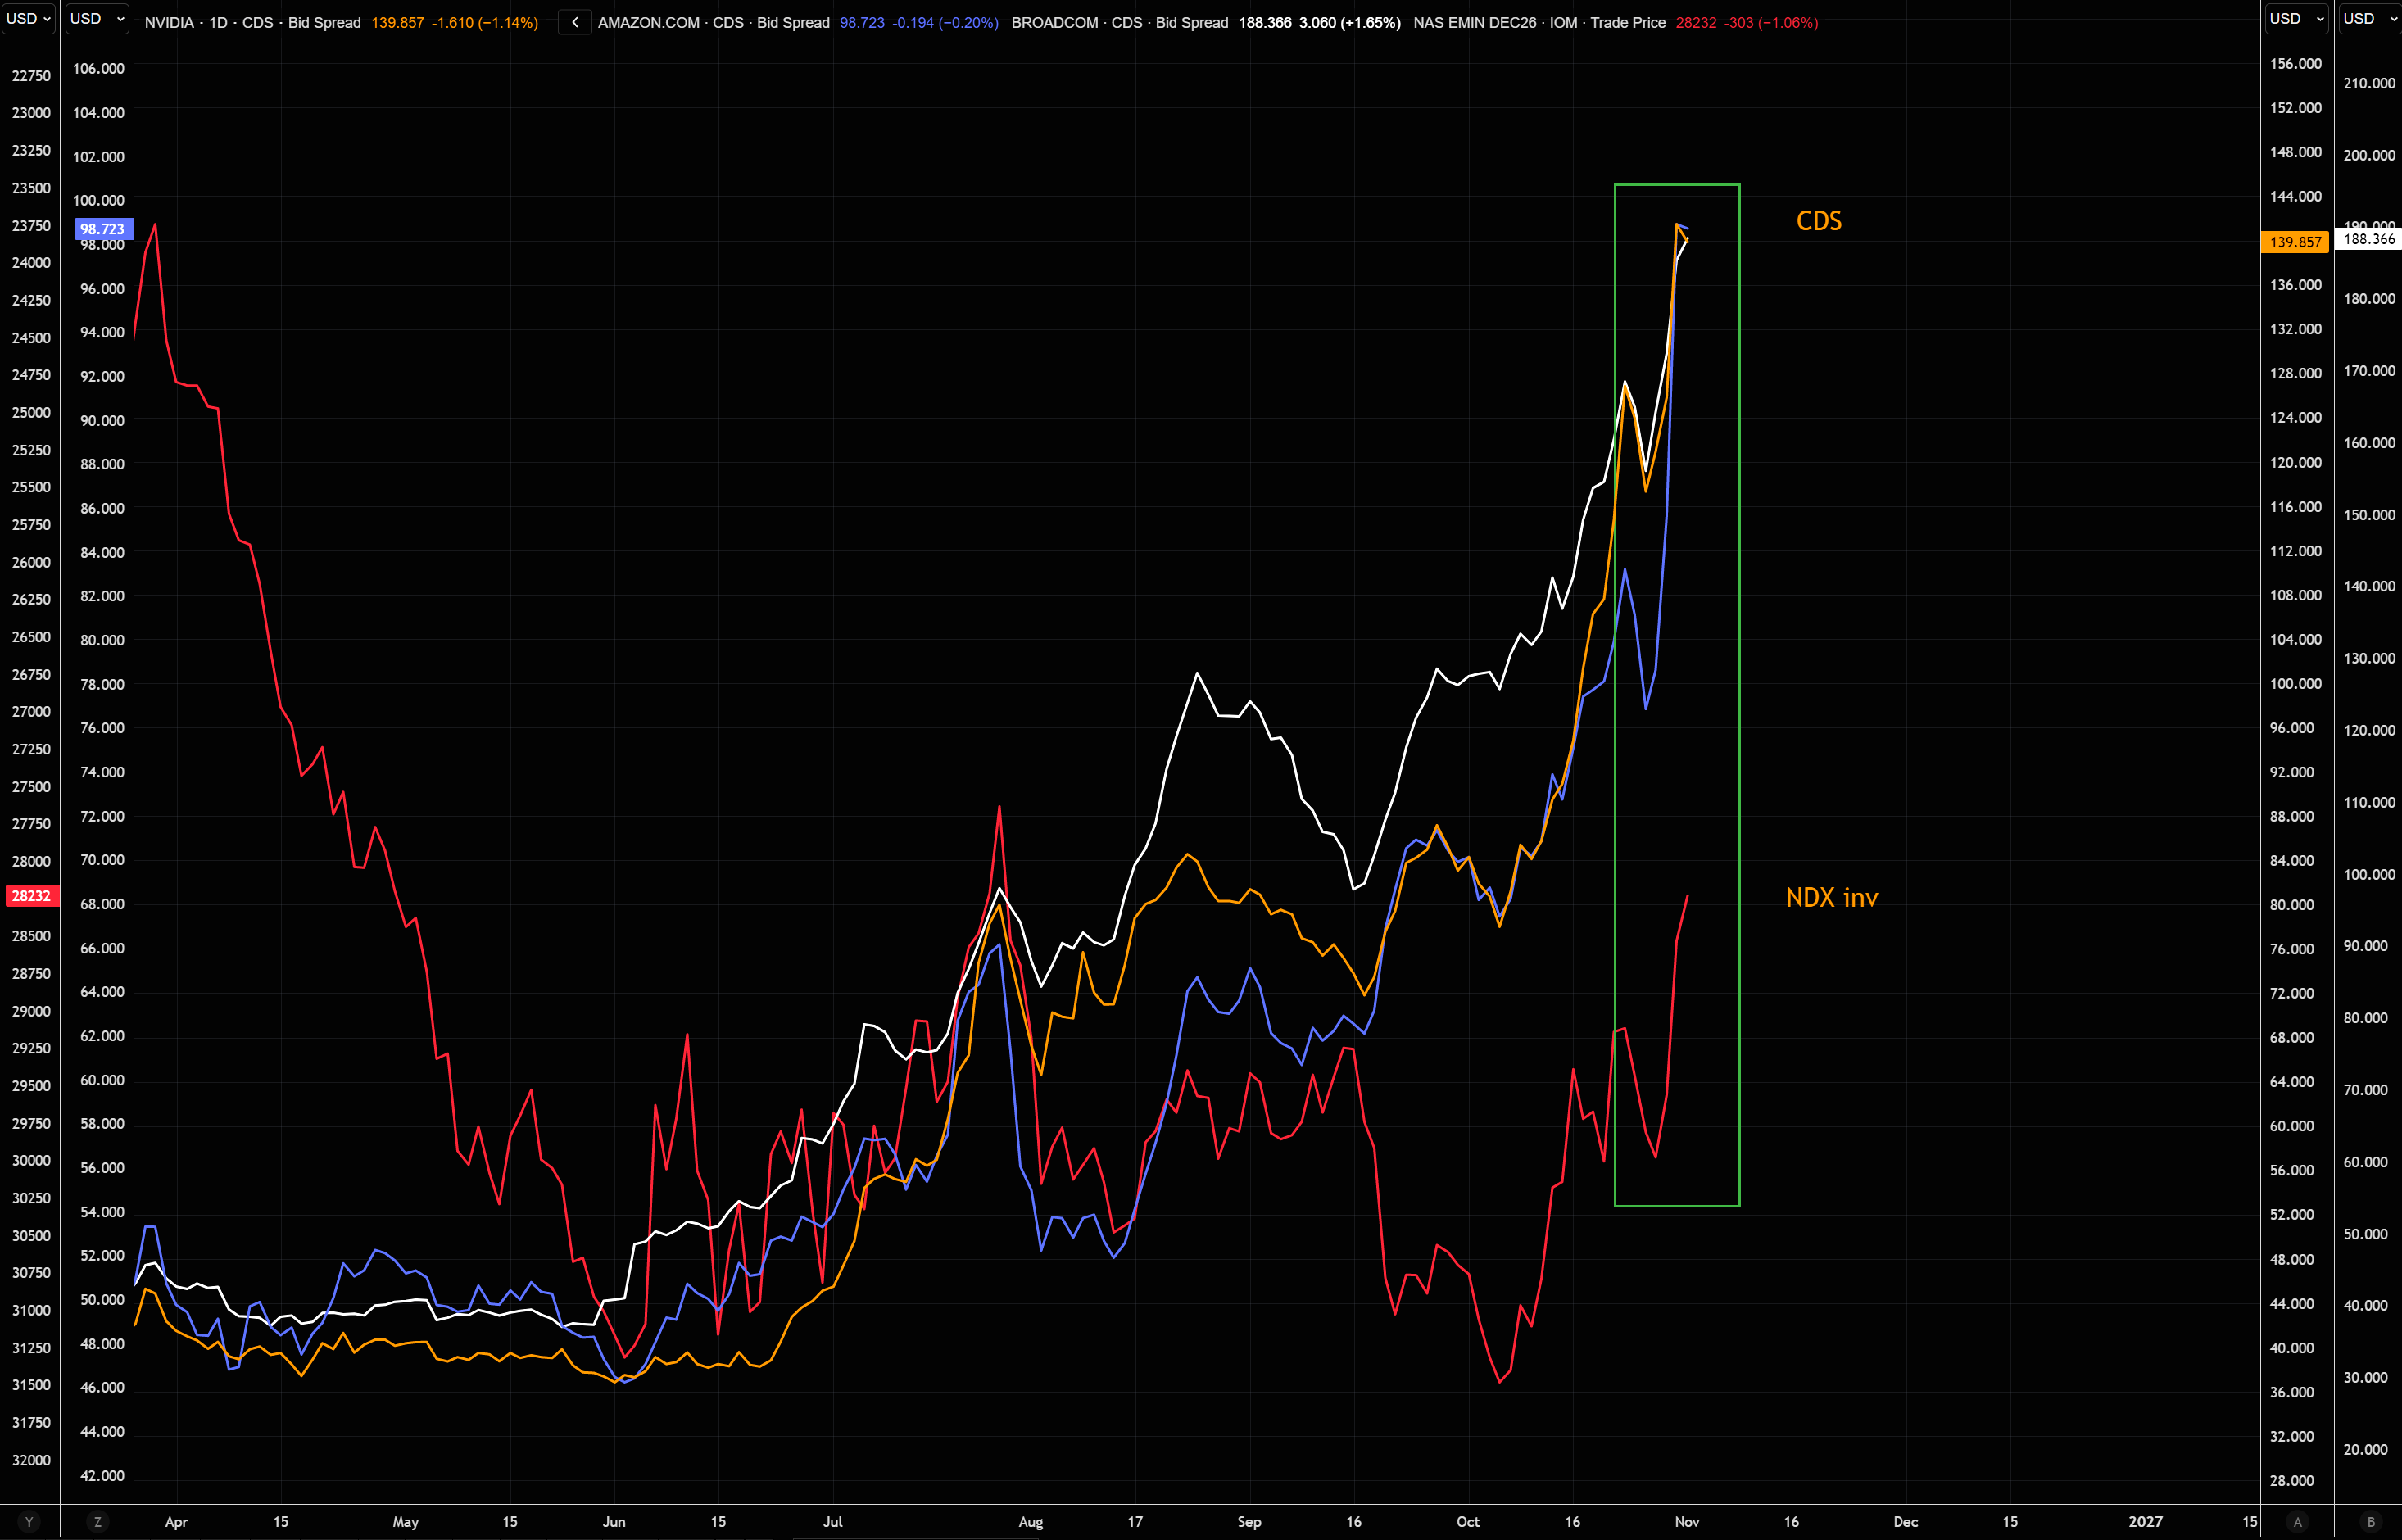
NDX is doing exactly what you would expect given how elevated major CDS spreads remain. Expecting a meaningful tech rebound while credit stress remains this pronounced is naive. More on exploding CDS spreads here.
Source: LSEG Workspace
The risk indicator
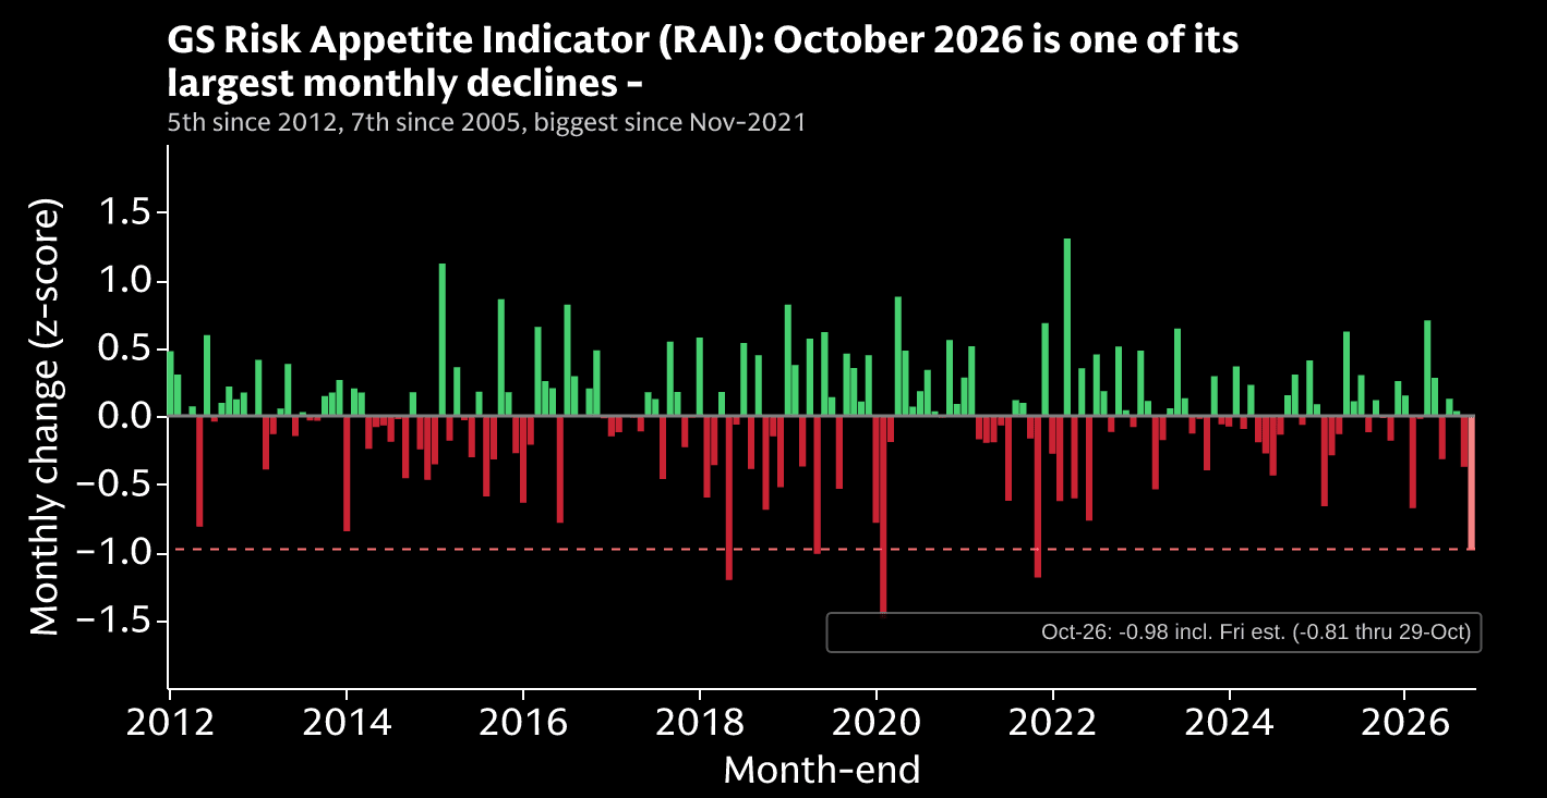
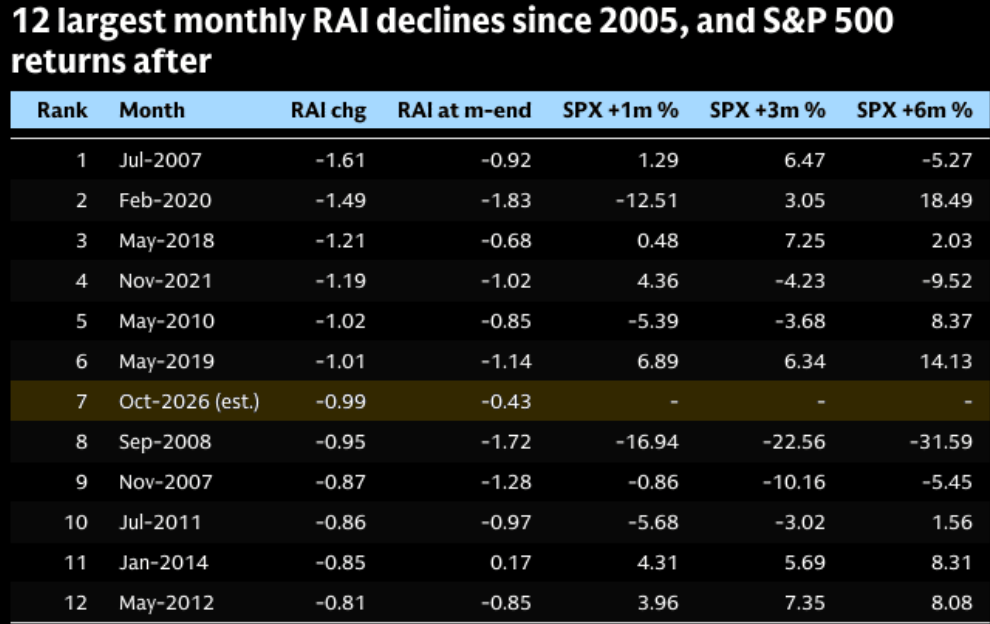
Goldman’s risk indicator suffered one of its largest monthly declines in October, highlighting the extent of the risk-off shift. Still, we are not quite at contrarian buy levels, which kick in below -1. Full note here.
Source: GS
Stress running high
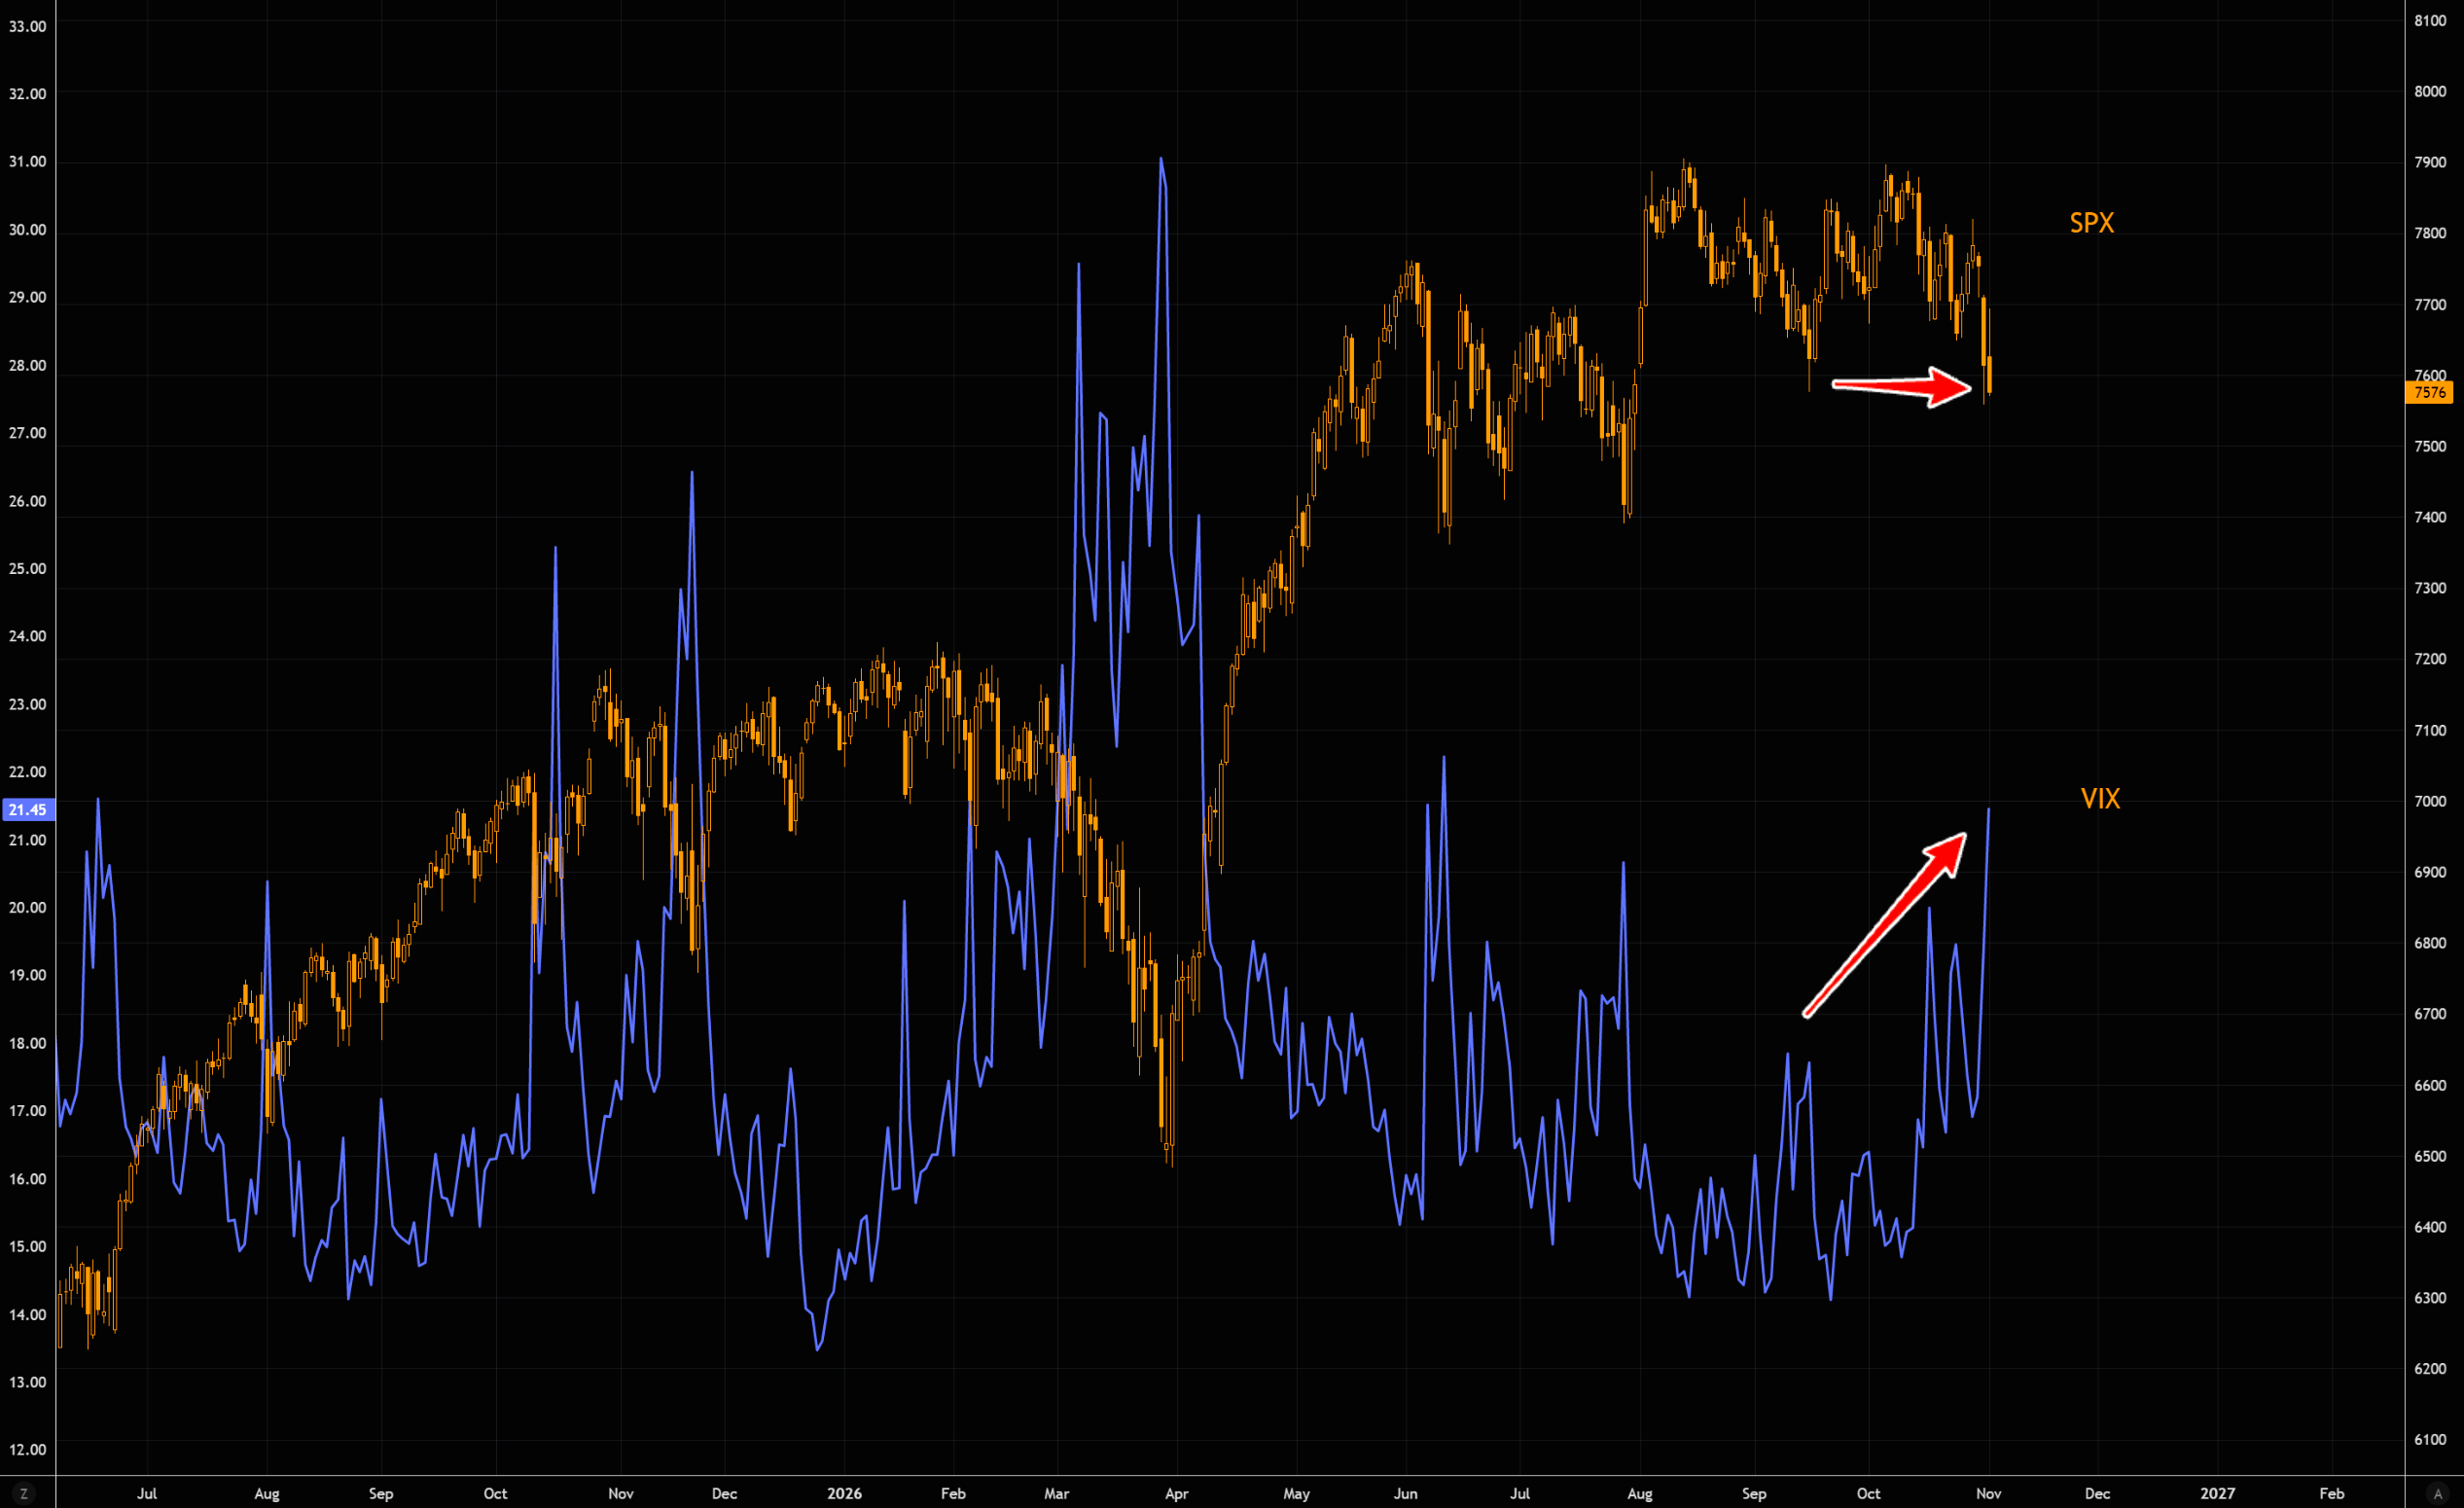
You don't compare trending and mean-reverting assets over longer timeframes, but the surge in VIX over the past few weeks has been rather aggressive, especially considering the SPX is only marginally below its mid-September levels.
Source: LSEG Workspace
Serious convexity
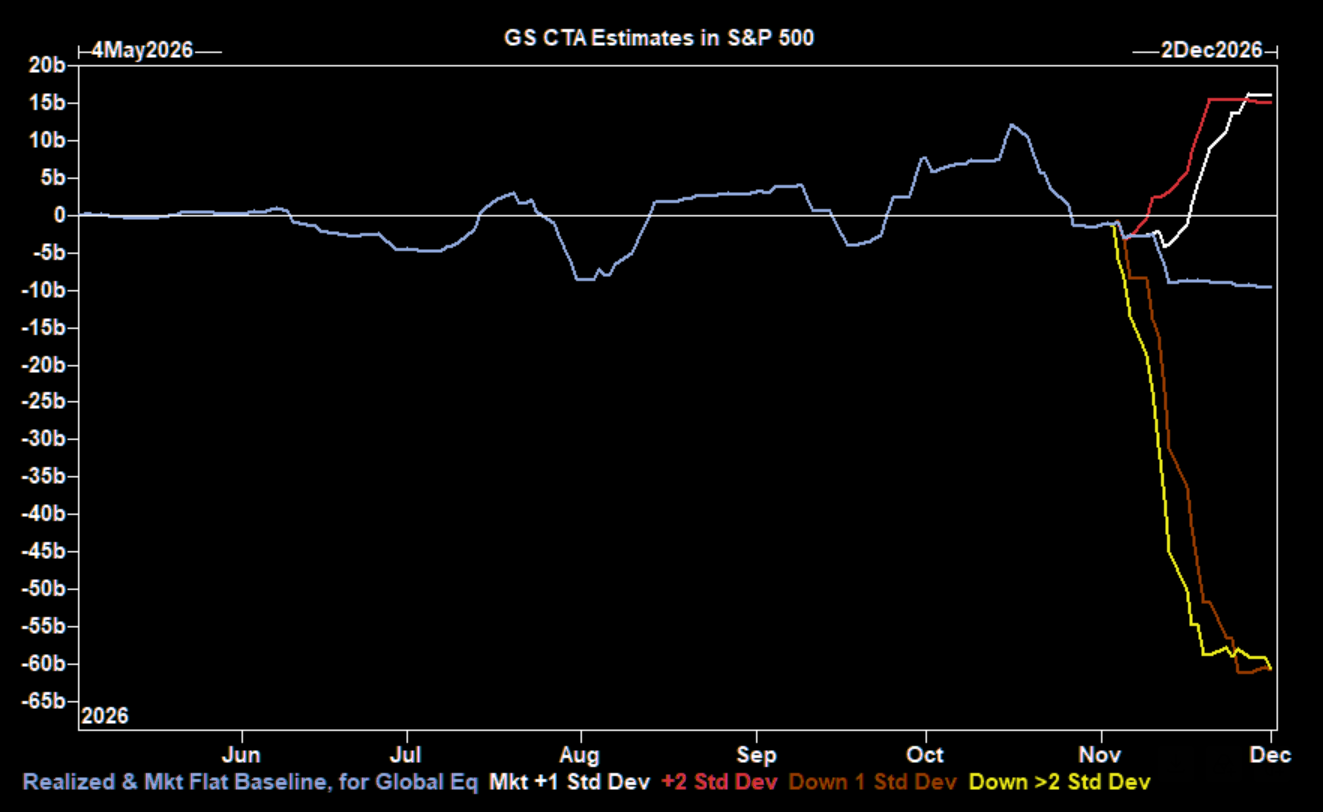
CTA flows look negligible in a flat tape this week, but the one-month setup is anything but calm. Downside selling could reach a massive $164bn in a falling market, while an upside move could trigger $120bn in buying. Serious flow convexity in both directions.
Key thresholds to watch: short-term 7,713, medium-term 7,544 and long-term 7,082. The medium-term level is the most important.
Source: GS

Source: TME/GS
Tech stress
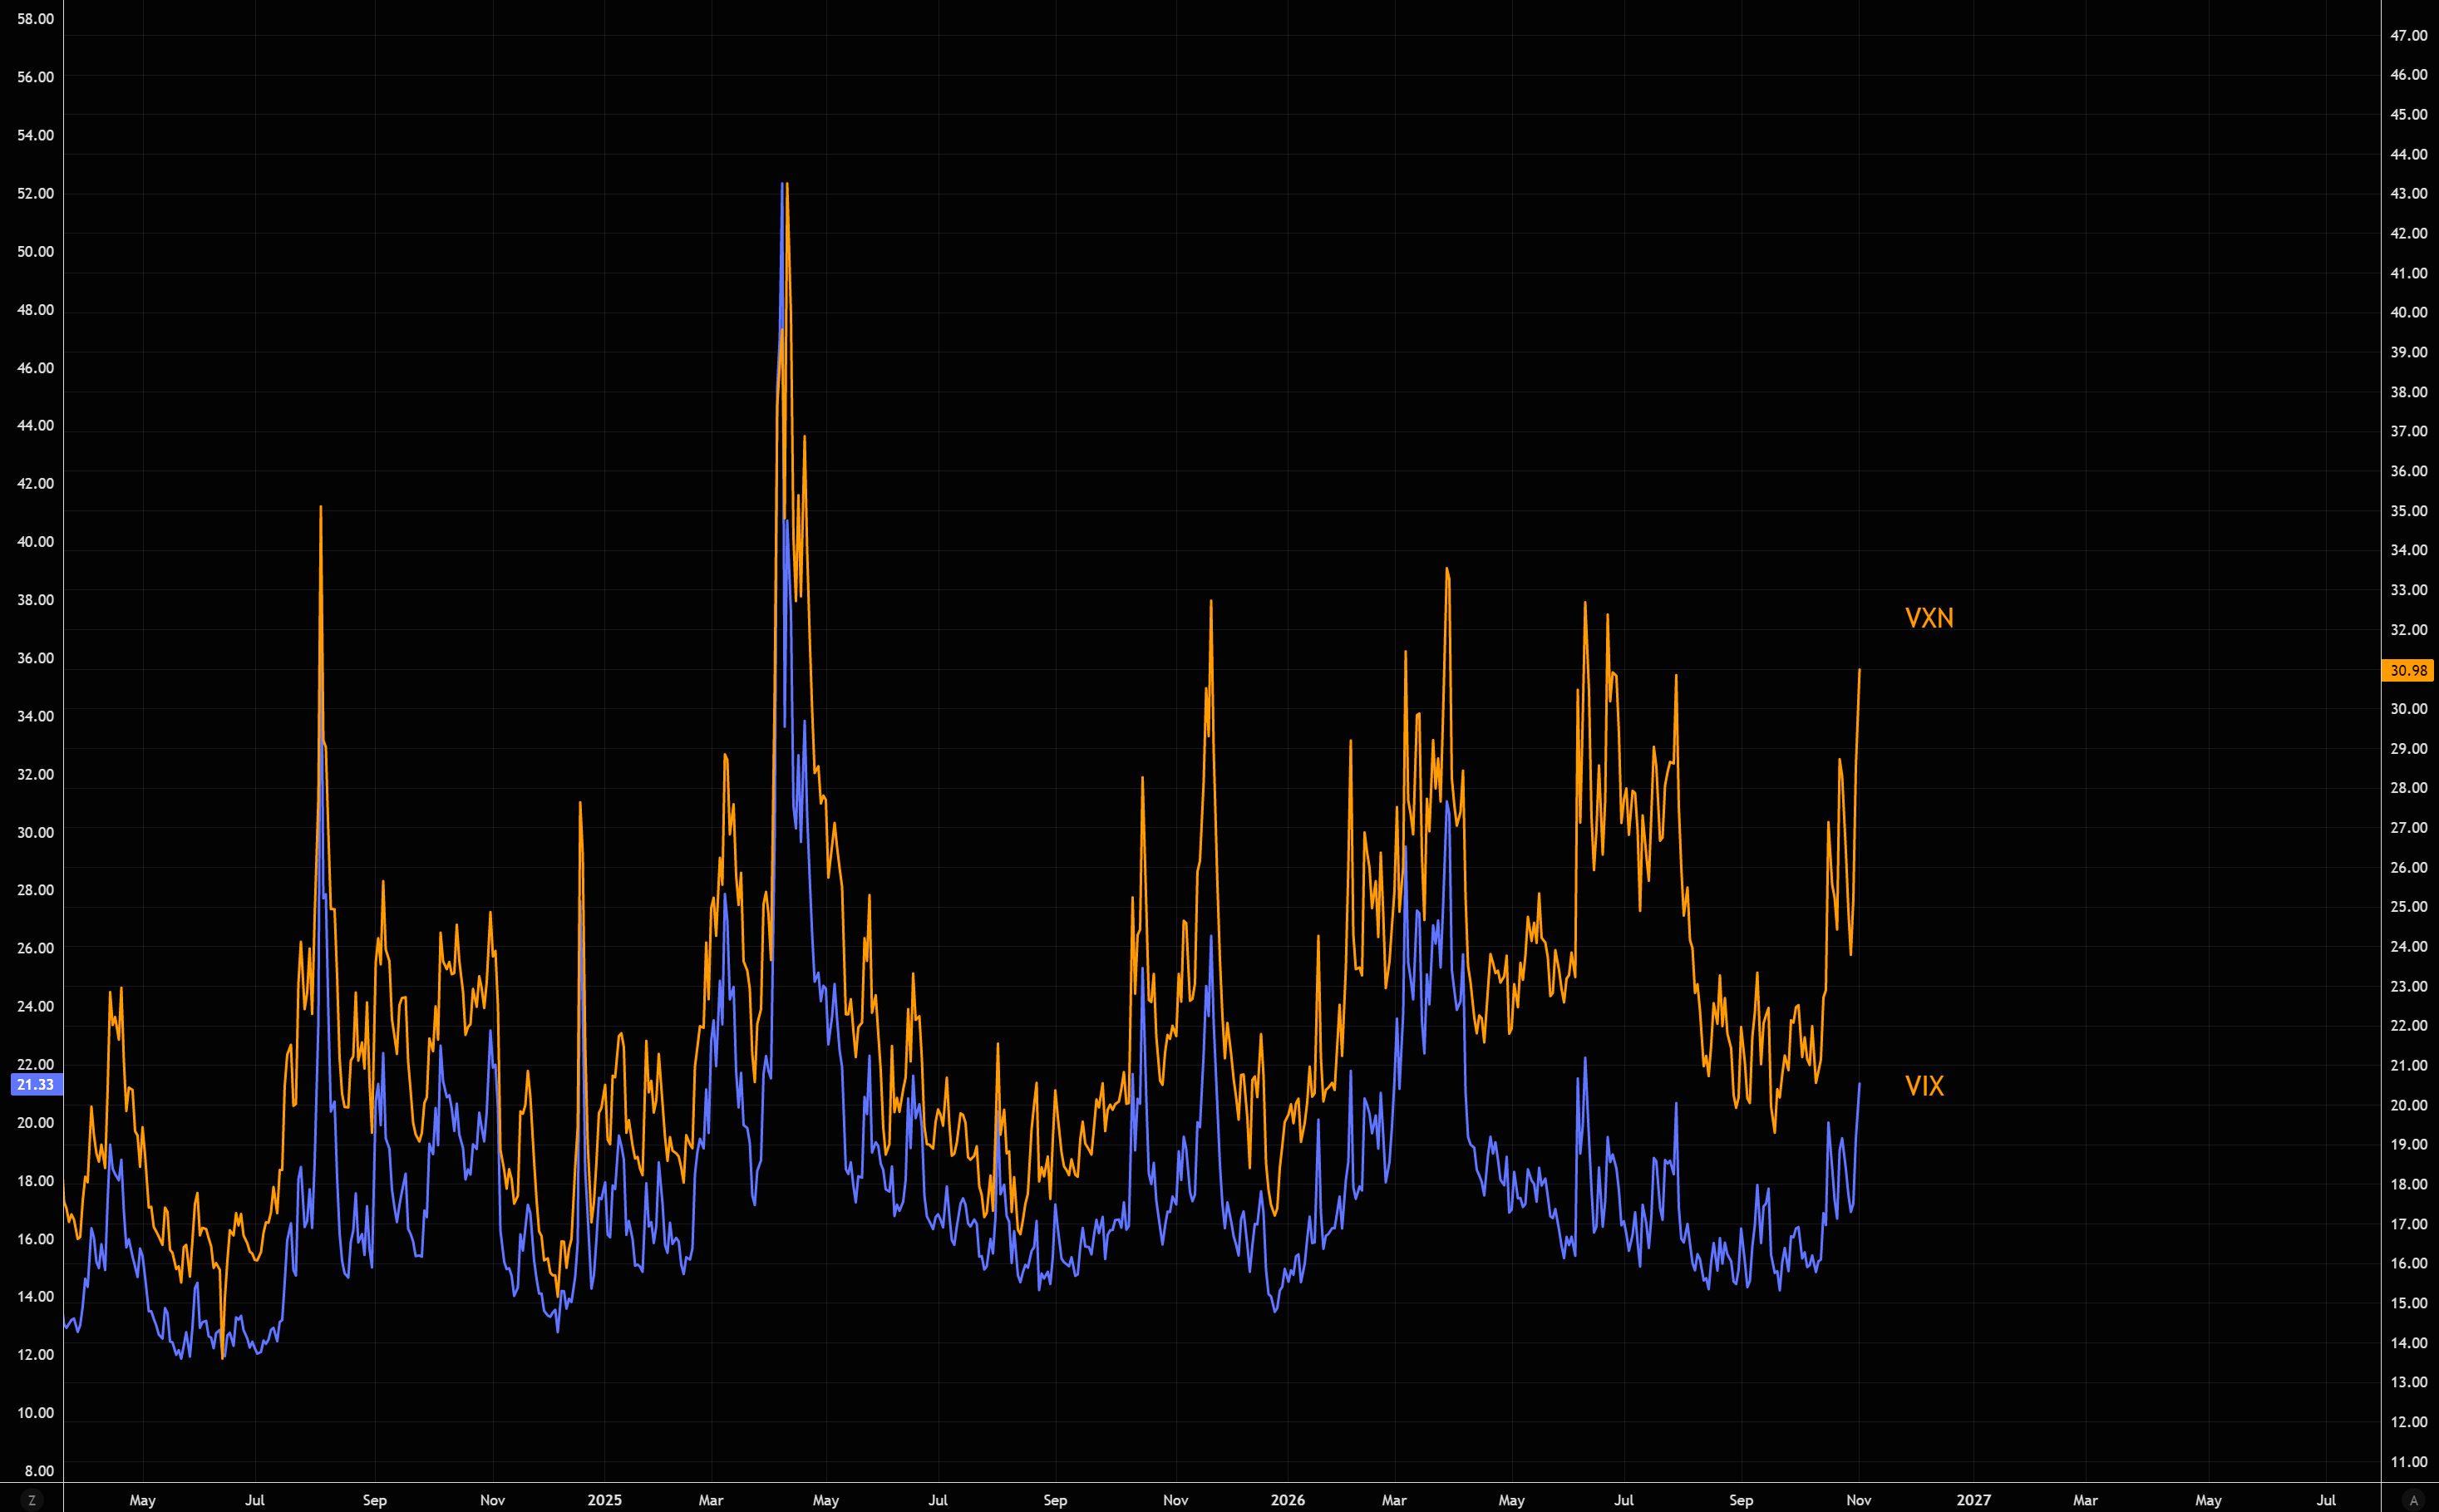
Tech stress is approaching its highest levels of the year, yet broader equity volatility remains far from the March panic extremes. The divergence is becoming increasingly interesting.
Source: LSEG Workspace
Anything but straightforward
History offers little comfort. Following the 11 largest declines in Goldman’s RAI since 2005, the S&P 500 has delivered returns ranging from -17% to +7% over one month and -32% to +18% over six months. In other words, the positioning reset is no guarantee of a bottom. Plenty of tail risk in both directions.
Source: GS
Slowing where it matters
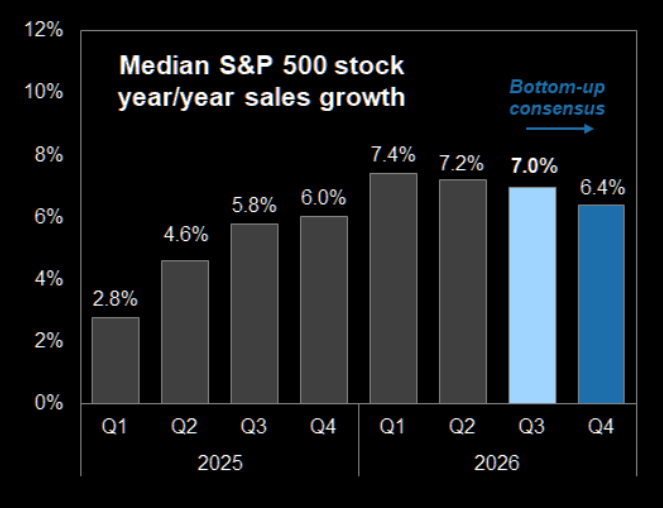
The median S&P 500 company saw revenue growth slow from 7.4% in Q1 to 7.2% in Q2 and 7.0% in Q3. Consensus expects another slowdown to 6.4% in Q4. Not exactly a collapse. But the direction is becoming increasingly difficult to spin. More here.
Source: FactSet
Tech P/E
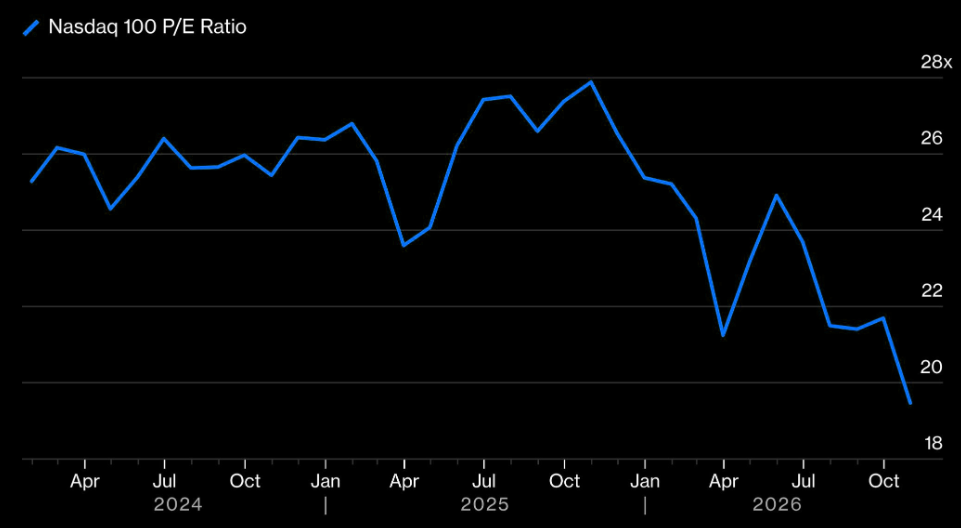
Tech valuations have compressed sharply as the selloff accelerates. Multiples are approaching levels not seen in some time. The irony? Just as investors are scrambling to abandon tech, the relative valuation argument is starting to look increasingly interesting. More here.
Source: Bloomberg
Low in SOX
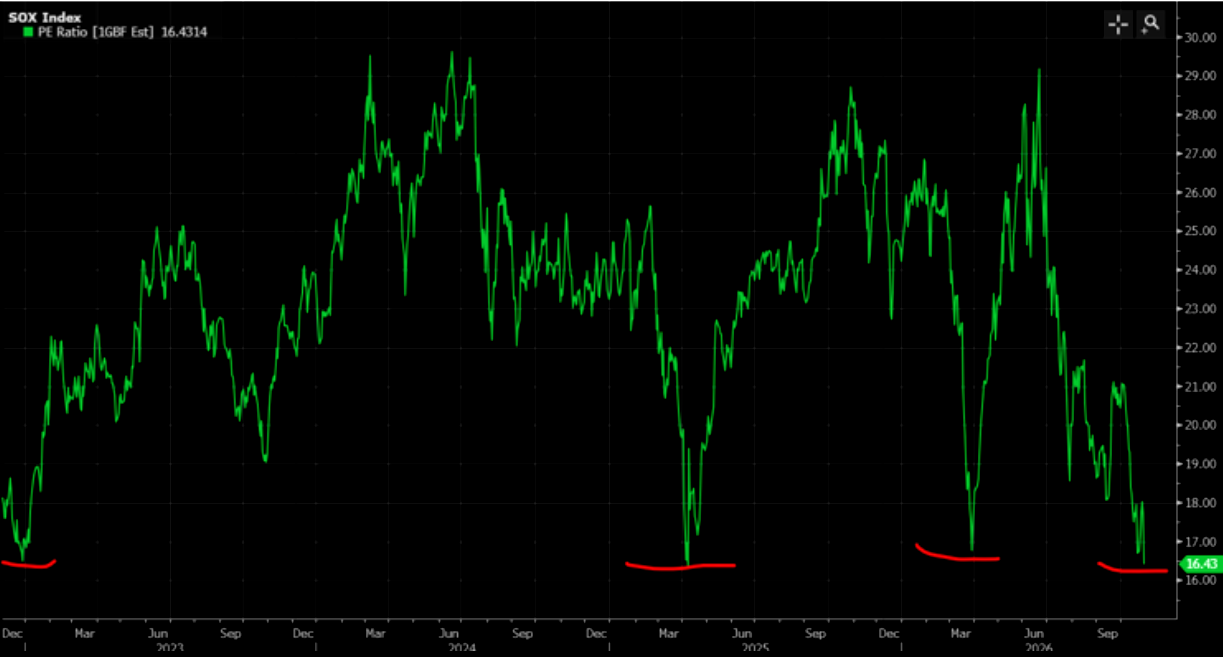
The SOX forward P/E multiple has fallen back to AI-cycle lows, trading at just 16x forward earnings. The valuation reset has been brutal. The question is whether cheaper multiples can finally attract buyers while momentum and credit remain this ugly.
Source: GS/Bloomberg
The oil long trap
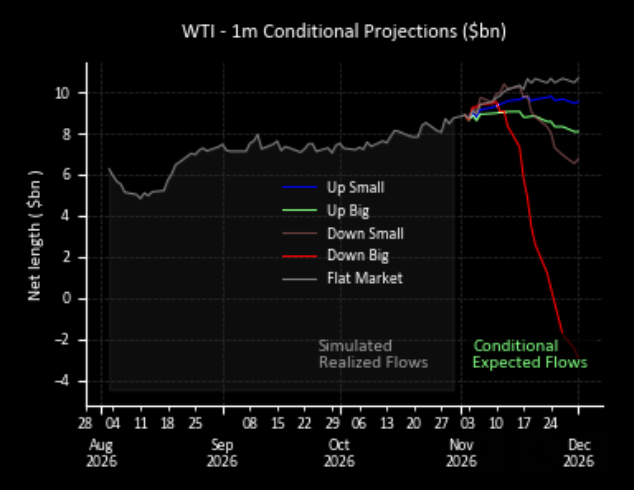
Trend followers entered today's selloff heavily long energy, leaving the market vulnerable to a potentially violent unwind. With key technical levels under pressure, systematic strategies could turn into aggressive sellers. CTA downside convexity is serious, raising the risk of a self-reinforcing liquidation.
Source: GS
Oil's volatility trap
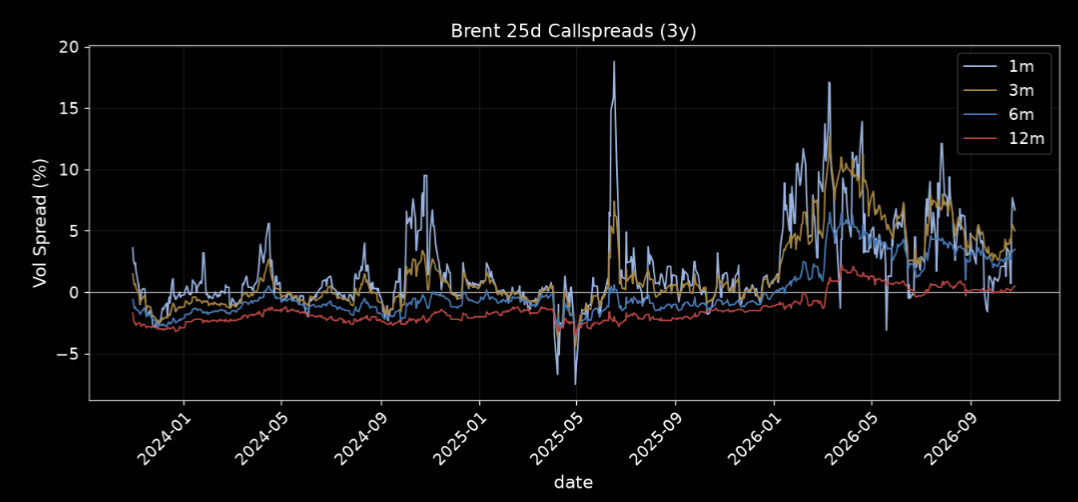
According to Goldman's Tallulah Adams, speculative and macro accounts returned as sizeable buyers of crude calls, while implied volatility surged and one-year volatility reached three-year highs. The options market has been pricing escalating upside risks, leaving a potentially nasty mismatch between bullish positioning and today's price action. More on oil here.